Pfizer 2012 Annual Report Download - page 114
Download and view the complete annual report
Please find page 114 of the 2012 Pfizer annual report below. You can navigate through the pages in the report by either clicking on the pages listed below, or by using the keyword search tool below to find specific information within the annual report.-
 1
1 -
2
-
3
-
4
-
5
-
6
-
7
-
8
-
9
-
10
-
11
-
12
-
13
-
14
-
15
-
16
-
17
-
18
-
19
-
20
-
21
-
22
-
23
-
24
-
25
-
26
-
27
-
28
-
29
-
30
-
31
-
32
-
33
-
34
-
35
-
36
-
37
-
38
-
39
-
40
-
41
-
42
-
43
-
44
-
45
-
46
-
47
-
48
-
49
-
50
-
51
-
52
-
53
-
54
-
55
-
56
-
57
-
58
-
59
-
60
-
61
-
62
-
63
-
64
-
65
-
66
-
67
-
68
-
69
-
70
-
71
-
72
-
73
-
74
-
75
-
76
-
77
-
78
-
79
-
80
-
81
-
82
-
83
-
84
-
85
-
86
-
87
-
88
-
89
-
90
-
91
-
92
-
93
-
94
-
95
-
96
-
97
-
98
-
99
-
100
-
101
-
102
-
103
-
 104
104 -
 105
105 -
 106
106 -
 107
107 -
 108
108 -
 109
109 -
 110
110 -
 111
111 -
 112
112 -
 113
113 -
 114
114 -
 115
115 -
 116
116 -
 117
117 -
 118
118 -
 119
119 -
 120
120 -
 121
121
 |
 |

Notes to Consolidated Financial Statements
Pfizer Inc. and Subsidiary Companies
2012 Financial Report
113
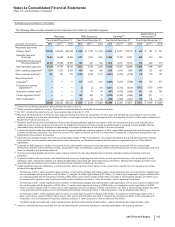
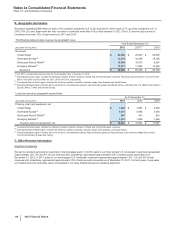
Selected income statement information
The following table provides selected income statement information by reportable segment:
Revenues R&D Expenses Earnings(a) Depreciation &
Amortization(b)
Year Ended December 31, Year Ended December 31, Year Ended December 31, Year Ended December 31,
(MILLIONS OF DOLLARS) 2012 2011(c) 2010 2012 2011(c) 2010 2012 2011(c) 2010 2012 2011(c) 2010
Reportable Segments:
Primary Care(d) $15,558 $ 22,670 $23,328 $ 1,009 $ 1,307 $ 1,473 $ 9,613 $15,001 $15,773 $244 $247 $201
Specialty Care and
Oncology 15,461 16,568 16,435 1,401 1,561 1,624 10,499 10,789 10,571 406 419 432
Established Products and
Emerging Markets(e) 20,195 18,509 18,760 403 441 452 11,218 9,417 10,100 410 422 418
Total reportable segments 51,214 57,747 58,523 2,813 3,309 3,549 31,330 35,207 36,444 1,060 1,088 1,051
Other operating segments(f) 7,511 7,212 6,323 693 425 428 1,919 2,009 1,565 245 232 197
Other business activities(g) 261 300 319 2,838 3,340 3,711 (2,891) (3,343) (3,735) 116 153 197
Reconciling Items:
Corporate(h) ———971 1,292 1,551 (6,240) (7,410) (7,966) 485 540 617
Purchase accounting
adjustments(i) ———(3) (2) 149 (4,957) (6,753) (8,136) 5,022 5,525 5,436
Acquisition-related costs(j) ——— 623 34 (967) (1,979) (3,926) 283 624 781
Certain significant items(k) ———522 654 18 (5,324) (4,347) (3,565) 300 611 —
Other unallocated(l) ———30 33 43 (790) (1,080) (1,210) 100 134 120
$58,986 $ 65,259 $65,165 $ 7,870 $ 9,074 $ 9,483 $12,080 $12,304 $ 9,471 $7,611 $8,907 $8,399
(a) Income from continuing operations before provision for taxes on income.
(b) Certain production facilities are shared. Deprecation is allocated based on estimates of physical production.
(c) For 2011, includes King commencing on the acquisition date of January 31, 2011.
(d) Revenues and Earnings from the Primary Care segment decreased for 2012 as compared to the prior year, and earnings as a percentage of revenues also
declined, primarily due to the loss of exclusivity of Lipitor in most major markets, and the subsequent shift in the reporting of Lipitor in those major markets to the
Established Products business unit.
(e) Revenues and Earnings from the Established Products and Emerging Markets segment increased in 2012 as compared to the prior year, primarily due to
additional products losing exclusivity and moving to the Established Products unit and increased operational sales in emerging markets, partially offset by
unfavorable foreign exchange. Earnings as a percentage of revenue increased due to the change in the mix of products.
(f) Includes the Animal Health operating segment and the Consumer Healthcare operating segment. In 2012, higher R&D expenses and lower Earnings reflect the
Consumer Healthcare acquisition of the over-the-counter (OTC) rights for Nexium (see Note 2A. Acquisitions, Divestitures, Collaborative Arrangements and
Equity-Method Investments: Acquisitions).
(g) Other business activities includes the revenues and operating results of Pfizer CentreSource, our contract manufacturing and bulk pharmaceutical chemical
sales operation, and the research and development costs managed by our Worldwide Research and Development organization and our Pfizer Medical
organization.
(h) Corporate for R&D expenses includes, among other things, administration expenses and compensation expenses associated with our research and
development activities and for Earnings includes, among other things, administration expenses, interest income/(expense) and certain compensation and other
costs not charged to our operating segments.
(i) Purchase accounting adjustments include certain charges related to the fair value adjustments to inventory, intangible assets and property, plant and
equipment.
(j) Acquisition-related costs can include costs associated with acquiring, integrating and restructuring newly acquired businesses, such as transaction costs,
integration costs, restructuring charges and additional depreciation associated with asset restructuring (see Note 3. Restructuring Charges and Other Costs
Associated with Acquisitions and Cost-Reduction/Productivity Initiatives for additional information).
(k) Certain significant items are substantive, unusual items that, either as a result of their nature or size, would not be expected to occur as part of our normal
business on a regular basis.
For Earnings in 2012, certain significant items includes: (i) restructuring charges and implementation costs associated with our cost-reduction initiatives that
are not associated with an acquisition of $1.9 billion, (ii) charges for certain legal matters of $2.2 billion, (iii) certain asset impairment charges of $884 million,
(iv) costs associated with the separation of Zoetis of $325 million and (v) other charges of $36 million (see Note 3. Restructuring Charges and Other Costs
Associated with Acquisitions and Cost-Reduction/Productivity Initiatives and Note 4. Other Deductions––Net for additional information).
For Earnings in 2011, certain significant items includes: (i) restructuring charges and implementation costs associated with our cost-reduction initiatives that
are not associated with an acquisition of $2.5 billion, (ii) certain asset impairment charges of $856 million, (iii) charges for certain legal matters of $822
million, (iv) other charges of $101 million and (v) costs associated with the separation of Zoetis of $35 million (see Note 3. Restructuring Charges and Other
Costs Associated with Acquisitions and Cost-Reduction/Productivity Initiatives and Note 4. Other Deductions––Net for additional information).
For Earnings in 2010, certain significant items includes: (i) certain asset impairment charges of $1.8 billion, (ii) charges for certain legal matters of $1.7
billion, (iii) inventory write-off of $212 million and (iv) other income of $102 million (see Note 3. Restructuring Charges and Other Costs Associated with
Acquisitions and Cost-Reduction/Productivity Initiatives and Note 4. Other Deductions––Net for additional information).
For R&D in all periods presented, certain significant items primarily reflect additional depreciation––asset restructuring and implementation costs.
(l) Includes overhead expenses associated with our manufacturing and commercial operations not directly attributable to an operating segment.