Pfizer 2012 Annual Report Download - page 94
Download and view the complete annual report
Please find page 94 of the 2012 Pfizer annual report below. You can navigate through the pages in the report by either clicking on the pages listed below, or by using the keyword search tool below to find specific information within the annual report.-
 1
1 -
2
-
3
-
4
-
5
-
6
-
7
-
8
-
9
-
10
-
11
-
12
-
13
-
14
-
15
-
16
-
17
-
18
-
19
-
20
-
21
-
22
-
23
-
24
-
25
-
26
-
27
-
28
-
29
-
30
-
31
-
32
-
33
-
34
-
35
-
36
-
37
-
38
-
39
-
40
-
41
-
42
-
43
-
44
-
45
-
46
-
47
-
48
-
49
-
50
-
51
-
52
-
53
-
54
-
55
-
56
-
57
-
58
-
59
-
60
-
61
-
62
-
63
-
64
-
65
-
66
-
67
-
68
-
69
-
70
-
71
-
72
-
73
-
74
-
75
-
76
-
77
-
78
-
79
-
80
-
81
-
82
-
83
-
 84
84 -
 85
85 -
 86
86 -
 87
87 -
 88
88 -
 89
89 -
 90
90 -
 91
91 -
 92
92 -
 93
93 -
 94
94 -
 95
95 -
 96
96 -
 97
97 -
 98
98 -
 99
99 -
 100
100 -
 101
101 -
 102
102 -
 103
103 -
 104
104 -
105
-
106
-
107
-
108
-
109
-
110
-
111
-
112
-
113
-
114
-
115
-
116
-
117
-
118
-
119
-
120
-
121
 |
 |

Notes to Consolidated Financial Statements
Pfizer Inc. and Subsidiary Companies
2012 Financial Report
93
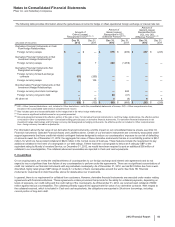
The following table provides the long-term target asset allocations ranges and the percentage of the fair value of plan assets for benefit plans:
As of December 31,
Target
Allocation Percentage Percentage of Plan Assets
(PERCENTAGES) 2012 2012 2011
U.S. qualified pension plans
Cash and cash equivalents 0-5 2.9% 17.6%
Equity securities 25-50 45.9%36.0%
Debt securities 30-55 35.5%30.4%
Real estate and other investments 10-15 15.7%16.0%
Total 100%100%100%
International pension plans
Cash and cash equivalents 0-5 3.9% 4.4%
Equity securities 25-50 51.6%50.0%
Debt securities 30-55 31.0%32.7%
Real estate and other investments 10-15 13.5%12.9%
Total 100%100%100.0%
U.S. postretirement plans
Cash and cash equivalents 0-5 4.4% 4.6%
Equity securities 10-35 20.1%9.7%
Debt securities 5-30 15.5%8.1%
Real estate, insurance contracts and other investments 55-70 60.0%77.6%
Total 100%100%100%
We utilize long-term asset allocation ranges in the management of our plans’ invested assets. Our long-term return expectations are
developed based on a diversified, global investment strategy that takes into account historical experience, as well as the impact of portfolio
diversification, active portfolio management, and our view of current and future economic and financial market conditions. As market
conditions and other factors change, we may adjust our targets accordingly and our asset allocations may vary from the target allocations.
Our long-term asset allocation ranges reflect our asset class return expectations and tolerance for investment risk within the context of the
respective plans’ long-term benefit obligations. These ranges are supported by analysis that incorporates historical and expected returns by
asset class, as well as volatilities and correlations across asset classes and our liability profile. This analysis, referred to as an asset-liability
analysis, also provides an estimate of expected returns on plan assets, as well as a forecast of potential future asset and liability balances.
The plans’ assets are managed with the objectives of minimizing pension expense and cash contributions over the long term. Asset liability
studies are performed periodically in order to support asset allocations.
The investment managers of each separately managed account are permitted to use derivative securities as described in their investment
management agreements.
Investment performance is reviewed on a monthly basis in total, as well as by asset class and individual manager, relative to one or more
benchmarks. Investment performance and detailed statistical analysis of both investment performance and portfolio holdings are conducted, a
large portion of which is presented to senior management on a quarterly basis. Periodic formal meetings are held with each investment
manager to review the investments.
E. Cash Flows
It is our practice to fund amounts for our qualified pension plans that are at least sufficient to meet the minimum requirements set forth in
applicable employee benefit laws and local tax laws.