Pfizer 2012 Annual Report Download - page 18
Download and view the complete annual report
Please find page 18 of the 2012 Pfizer annual report below. You can navigate through the pages in the report by either clicking on the pages listed below, or by using the keyword search tool below to find specific information within the annual report.-
 1
1 -
2
-
3
-
4
-
5
-
6
-
7
-
 8
8 -
 9
9 -
 10
10 -
 11
11 -
 12
12 -
 13
13 -
 14
14 -
 15
15 -
 16
16 -
 17
17 -
 18
18 -
 19
19 -
 20
20 -
 21
21 -
 22
22 -
 23
23 -
 24
24 -
 25
25 -
 26
26 -
 27
27 -
 28
28 -
29
-
30
-
31
-
32
-
33
-
34
-
35
-
36
-
37
-
38
-
39
-
40
-
41
-
42
-
43
-
44
-
45
-
46
-
47
-
48
-
49
-
50
-
51
-
52
-
53
-
54
-
55
-
56
-
57
-
58
-
59
-
60
-
61
-
62
-
63
-
64
-
65
-
66
-
67
-
68
-
69
-
70
-
71
-
72
-
73
-
74
-
75
-
76
-
77
-
78
-
79
-
80
-
81
-
82
-
83
-
84
-
85
-
86
-
87
-
88
-
89
-
90
-
91
-
92
-
93
-
94
-
95
-
96
-
97
-
98
-
99
-
100
-
101
-
102
-
103
-
104
-
105
-
106
-
107
-
108
-
109
-
110
-
111
-
112
-
113
-
114
-
115
-
116
-
117
-
118
-
119
-
120
-
121
 |
 |

Financial Review
Pfizer Inc. and Subsidiary Companies
2012 Financial Report
17
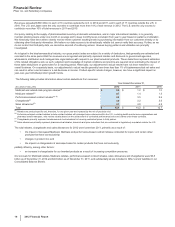
Revenues by Segment and Geographic Area
The following table provides Worldwide revenues by operating segment, business unit and geographic area:
Year Ended December 31, % Change
Worldwide U.S. International Worldwide U.S. International
(MILLIONS OF
DOLLARS) 2012 2011(a) 2010 2012 2011(a) 2010 2012 2011(a) 2010 12/11 11/10 12/11 11/10 12/11 11/10
Biopharmaceutical
revenues:
Primary Care
Operating Segment $ 15,558 $ 22,670 $ 23,328 $ 8,191 $ 12,819 $ 13,536 $ 7,367 $ 9,851 $ 9,792 (31) (3) (36) (5) (25) 1
Specialty Care 14,151 15,245 15,021 6,206 6,870 7,419 7,945 8,375 7,602 (7) 1(10) (7) (5) 10
Oncology 1,310 1,323 1,414 573 391 506 737 932 908 (1) (6) 47 (23) (21) 3
SC&O Operating
Segment 15,461 16,568 16,435 6,779 7,261 7,925 8,682 9,307 8,510 (7) 1(7) (8) (7) 9
Emerging Markets 9,960 9,295 8,662 ———9,960 9,295 8,662 77——77
Established
Products 10,235 9,214 10,098 4,738 3,627 4,501 5,497 5,587 5,597 11 (9) 31 (19) (2) —
EP&EM Operating
Segment 20,195 18,509 18,760 4,738 3,627 4,501 15,457 14,882 14,259 9(1) 31 (19) 44
51,214 57,747 58,523 19,708 23,707 25,962 31,506 34,040 32,561 (11) (1) (17) (9) (7) 5
Other product
revenues:
Animal Health 4,299 4,184 3,575 1,771 1,648 1,382 2,528 2,536 2,193 317 719 —16
Consumer
Healthcare 3,212 3,028 2,748 1,526 1,490 1,408 1,686 1,538 1,340 610 2610 15
Other operating
segments 7,511 7,212 6,323 3,297 3,138 2,790 4,214 4,074 3,533 414 512 315
Other(b) 261 300 319 81 88 103 180 212 216 (13) (6) (8) (15) (15) (2)
Total Revenues $ 58,986 $ 65,259 $ 65,165 $ 23,086 $ 26,933 $ 28,855 $ 35,900 $ 38,326 $ 36,310 (10) —(14) (7) (6) 6
(a) For 2011, includes King commencing on the acquisition date of January 31, 2011.
(b) Includes revenues generated primarily from Pfizer CentreSource, our contract manufacturing and bulk pharmaceutical chemical sales organization.
Biopharmaceutical Revenues
Revenues from biopharmaceutical products contributed approximately 87% of our total revenues in 2012, 88% of our total revenues in 2011
and 90% of our total revenues in 2010.
We recorded direct product sales of more than $1 billion for each of 10 biopharmaceutical products in 2012, each of 12 biopharmaceutical
products in 2011 and each of 15 biopharmaceutical products in 2010. These products represent 49% of our revenues from biopharmaceutical
products in 2012, 56% of our revenues from biopharmaceutical products in 2011 and 60% of our revenues from biopharmaceutical products in
2010.
2012 v. 2011
Worldwide revenues from biopharmaceutical products in 2012 were $51.2 billion, a decrease of 11% compared to 2011, primarily due to:
• the decrease of $7.6 billion in operational revenues from Lipitor, Geodon, Xalatan, Caduet, Aromasin and Detrol, and lower Alliance
revenues for Aricept, all due to loss of exclusivity in certain markets, and from lower Alliance revenues for Spiriva due to the final-year
terms of our collaboration agreements in certain European countries, Canada and Australia; lower revenues for Effexor and Zosyn/
Tazocin; and
• the unfavorable impact of foreign exchange of $1.3 billion, or 2%,
partially offset by:
• an increase in operational revenues in developed markets for certain biopharmaceutical products, particularly Lyrica, Celebrex, and
Enbrel, and in revenues from emerging markets.
Geographically,
• in the U.S., revenues from biopharmaceutical products decreased 17% in 2012, compared to 2011, primarily reflecting lower revenues
from Lipitor, Geodon, Caduet, Xalatan and Aromasin, all due to loss of exclusivity; lower Alliance revenues due to loss of exclusivity of
Aricept 5mg and 10mg tablets in November 2010; and lower revenues from Effexor, Zosyn and Detrol/Detrol LA. The impact of these
adverse factors was partially offset by the strong performance of certain other biopharmaceutical products, lower reductions related to
rebates and the lower reduction in revenues related to the U.S. Healthcare Legislation.