Pfizer 2012 Annual Report Download - page 73
Download and view the complete annual report
Please find page 73 of the 2012 Pfizer annual report below. You can navigate through the pages in the report by either clicking on the pages listed below, or by using the keyword search tool below to find specific information within the annual report.-
 1
1 -
2
-
3
-
4
-
5
-
6
-
7
-
8
-
9
-
10
-
11
-
12
-
13
-
14
-
15
-
16
-
17
-
18
-
19
-
20
-
21
-
22
-
23
-
24
-
25
-
26
-
27
-
28
-
29
-
30
-
31
-
32
-
33
-
34
-
35
-
36
-
37
-
38
-
39
-
40
-
41
-
42
-
43
-
44
-
45
-
46
-
47
-
48
-
49
-
50
-
51
-
52
-
53
-
54
-
55
-
56
-
57
-
58
-
59
-
60
-
61
-
62
-
 63
63 -
 64
64 -
 65
65 -
 66
66 -
 67
67 -
 68
68 -
 69
69 -
 70
70 -
 71
71 -
 72
72 -
 73
73 -
 74
74 -
 75
75 -
 76
76 -
 77
77 -
 78
78 -
 79
79 -
 80
80 -
 81
81 -
 82
82 -
 83
83 -
84
-
85
-
86
-
87
-
88
-
89
-
90
-
91
-
92
-
93
-
94
-
95
-
96
-
97
-
98
-
99
-
100
-
101
-
102
-
103
-
104
-
105
-
106
-
107
-
108
-
109
-
110
-
111
-
112
-
113
-
114
-
115
-
116
-
117
-
118
-
119
-
120
-
121
 |
 |

Notes to Consolidated Financial Statements
Pfizer Inc. and Subsidiary Companies
72
2012 Financial Report
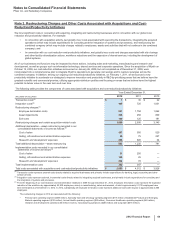
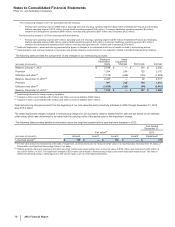
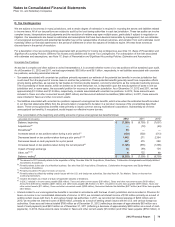
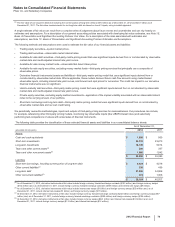
The following table provides additional information about the intangible assets that were impaired in 2012:
Year Ended
December 31,
Fair Value(a) 2012
(MILLIONS OF DOLLARS) Amount Level 1 Level 2 Level 3 Impairment
Intangible assets––IPR&D(b) $ 54$ —$ —$ 54$ 393
Intangible assets––Other(b) 1,006 ——
1,006 479
Total $1,060 $—$—$
1,060 $872
(a) The fair value amount is presented as of the date of impairment, as these assets are not measured at fair value on a recurring basis. See also Note 1E.
Basis of Presentation and Significant Accounting Policies: Fair Value.
(b) Reflects intangible assets written down to their estimated fair value of $1.1 billion in 2012. The impairment charges of $872 million are included in Other
deductions––net. Fair value is determined using the income approach, specifically the multi-period excess earnings method, also known as the discounted
cash flow method. We start with a forecast of all the expected net cash flows associated with the asset, which includes the application of a terminal value for
indefinite-lived assets, and then we apply an asset-specific discount rate to arrive at a net present value amount. Some of the more significant estimates and
assumptions inherent in this approach include: the amount and timing of the projected net cash flows, which includes the expected impact of competitive, legal
and/or regulatory forces on the projections and the impact of technological risk associated with IPR&D assets, as well as the selection of a long-term growth
rate; the discount rate, which seeks to reflect the various risks inherent in the projected cash flows; and the tax rate, which seeks to incorporate the geographic
diversity of the projected cash flows.
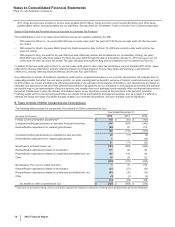
Note 5. Tax Matters
A. Taxes on Income from Continuing Operations
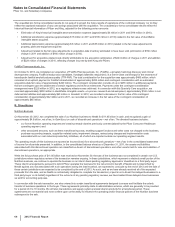
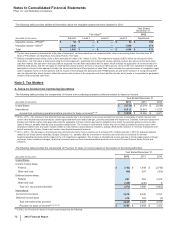
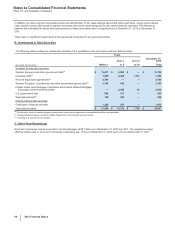
The following table provides the components of Income from continuing operations before provision for taxes on income:
Year Ended December 31,
(MILLIONS OF DOLLARS) 2012 2011 2010
United States $ (4,732) $(2,210)$ (2,256)
International 16,812 14,514 11,727
Income from continuing operations before provision for taxes on income(a), (b) $12,080 $12,304 $9,471
(a) 2012 v. 2011––The increase in the domestic loss was primarily due to the reduction in revenues resulting from the loss of exclusivity of Lipitor, Geodon and
certain other biopharmaceutical products; certain legal settlements and related charges, primarily associated with Rapamune, Celebrex, hormone-replacement
therapy and Chantix; higher costs associated with the separation of Zoetis; and the payment to AstraZeneca to obtain the exclusive global over-the-counter
rights to Nexium, partially offset by lower acquisition-related costs. The increase in international income was due to lower purchase accounting costs, lower
acquisition-related costs, and lower charges related to cost-reduction and productivity initiatives, partially offset by the reduction in revenues resulting from the
loss of exclusivity of Lipitor, Geodon and certain other biopharmaceutical products.
(b) 2011 v. 2010––The decrease in the domestic loss was primarily due to the non-recurrence of a charge of $1.3 billion (pre-tax) in 2010 for asbestos litigation
related to our wholly owned subsidiary, Quigley Company, Inc., partially offset by a reduction in revenues due to the loss of exclusivity for several
biopharmaceutical products and the impact of the U.S. Healthcare Legislation. The increase in international income was due to the favorable impact of foreign
exchange, lower impairment charges, as well as increased revenues from biopharmaceutical products, such as the Prevnar/Prevenar family, Enbrel and
Celebrex.
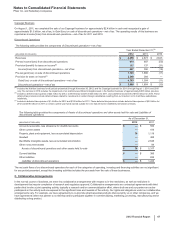
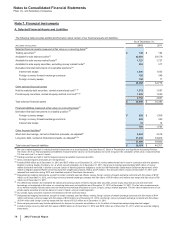
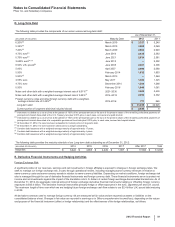
The following table provides the components of Provision for taxes on income based on the location of the taxing authorities:
Year Ended December 31,
(MILLIONS OF DOLLARS) 2012 2011 2010
United States
Current income taxes:
Federal $(752)$1,349 $(2,790)
State and local (44)207 (323)
Deferred income taxes:
Federal 851 364 2,103
State and local (328)(240)8
Total U.S. tax provision/(benefit) (273)1,680 (1,002)
International
Current income taxes 2,619 2,046 2,157
Deferred income taxes 216 183 (2)
Total international tax provision 2,835 2,229 2,155
Provision for taxes on income(a), (b), (c), (d) $2,562 $3,909 $1,153
(a) In 2012, the Provision for taxes on income was impacted by the following: