Pfizer 2012 Annual Report Download - page 32
Download and view the complete annual report
Please find page 32 of the 2012 Pfizer annual report below. You can navigate through the pages in the report by either clicking on the pages listed below, or by using the keyword search tool below to find specific information within the annual report.-
 1
1 -
2
-
3
-
4
-
5
-
6
-
7
-
8
-
9
-
10
-
11
-
12
-
13
-
14
-
15
-
16
-
17
-
18
-
19
-
20
-
21
-
 22
22 -
 23
23 -
 24
24 -
 25
25 -
 26
26 -
 27
27 -
 28
28 -
 29
29 -
 30
30 -
 31
31 -
 32
32 -
 33
33 -
 34
34 -
 35
35 -
 36
36 -
 37
37 -
 38
38 -
 39
39 -
 40
40 -
 41
41 -
 42
42 -
43
-
44
-
45
-
46
-
47
-
48
-
49
-
50
-
51
-
52
-
53
-
54
-
55
-
56
-
57
-
58
-
59
-
60
-
61
-
62
-
63
-
64
-
65
-
66
-
67
-
68
-
69
-
70
-
71
-
72
-
73
-
74
-
75
-
76
-
77
-
78
-
79
-
80
-
81
-
82
-
83
-
84
-
85
-
86
-
87
-
88
-
89
-
90
-
91
-
92
-
93
-
94
-
95
-
96
-
97
-
98
-
99
-
100
-
101
-
102
-
103
-
104
-
105
-
106
-
107
-
108
-
109
-
110
-
111
-
112
-
113
-
114
-
115
-
116
-
117
-
118
-
119
-
120
-
121
 |
 |

Financial Review
Pfizer Inc. and Subsidiary Companies
2012 Financial Report
31
St. Louis, MO. We still maintain laboratories in St. Louis, MO, that focus on the areas of biologics and indications discovery. We are
presently marketing for sale, lease or sale/lease-back, either a portion of or all of certain of our R&D campuses. Locations with R&D
operations are in the U.S., Europe, Canada and China, with five major research sites in addition to a number of specialized units. We
also re-prioritized our commitments to disease areas and have discontinued certain therapeutic areas and R&D programs as part of
our R&D productivity initiative. In 2011 and 2012 our research has primarily focused on five high-priority areas that have a mix of small
and large molecules—immunology and inflammation; oncology; cardiovascular and metabolic diseases; neuroscience and pain; and
vaccines.
• Workforce reductions across all areas of our business and other organizational changes, primarily in the U.S. field force, manufacturing,
R&D and corporate functions. We identified areas for a reduction in workforce across all of our businesses. In January 2009, when Pfizer
and Wyeth entered into the merger agreement, the workforce of the two companies totaled approximately 130,000. We have exceeded
our original target to reduce the combined Pfizer/Wyeth workforce 15%, or 19,500, within three years. By the end of 2011, we achieved a
reduction of 26,300, and by the end of 2012, we achieved a reduction of 38,500. In 2012, the workforce declined by 12,200, from 103,700
to 91,500, primarily in manufacturing, R&D and corporate functions. The aforementioned workforce reductions include the impact of
acquisitions and divestitures subsequent to the Wyeth acquisition.
• The increased use of shared services and centers of excellence.
• Procurement savings.
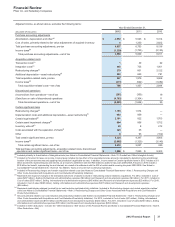
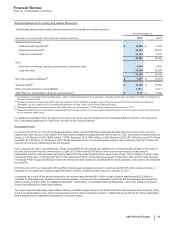
The following table provides the components of costs associated with acquisitions and cost-reduction/productivity initiatives:
Year Ended December 31,
(MILLIONS OF DOLLARS) 2012 2011 2010
Transaction costs(a) $1$30$22
Integration costs(b) 405 725 1,001
Restructuring charges(c):
Employee termination costs 997 1,794 1,062
Asset impairments 328 256 869
Exit costs 149 125 191
Restructuring charges and certain acquisition-related costs 1,880 2,930 3,145
Additional depreciation––asset restructuring, recorded in our consolidated
statements of income as follows(d):
Cost of sales 267 555 520
Selling, informational and administrative expenses 20 75 227
Research and development expenses 296 605 34
Total additional depreciation––asset restructuring 583 1,235 781
Implementation costs, recorded in our consolidated
statements of income as follows(e):
Cost of sales 31 250 —
Selling, informational and administrative expenses 129 25 —
Research and development expenses 232 72 —
Total implementation costs 392 347 —
Total costs associated with acquisitions and cost-reduction/productivity initiatives $2,855 $4,512 $3,926
(a) Transaction costs represent external costs directly related to acquired businesses and primarily include expenditures for banking, legal, accounting and other
similar services.
(b) Integration costs represent external, incremental costs directly related to integrating acquired businesses, and primarily include expenditures for consulting and
the integration of systems and processes.
(c) From the beginning of our cost-reduction and transformation initiatives in 2005 through December 31, 2012, Employee termination costs represent the expected
reduction of the workforce by approximately 62,200 employees, mainly in manufacturing, sales and research, of which approximately 51,700 employees have
been terminated as of December 31, 2012. In 2012, substantially all employee termination costs represent additional costs with respect to approximately 4,800
employees.
The restructuring charges in 2012 are associated with the following:
• Primary Care operating segment ($295 million), Specialty Care and Oncology operating segment ($175 million), Established Products and Emerging
Markets operating segment ($125 million), Animal Health operating segment ($59 million), Consumer Healthcare operating segment ($45 million),
research and development operations ($6 million income), manufacturing operations ($265 million) and Corporate ($516 million).
The restructuring charges in 2011 are associated with the following:
• Primary Care operating segment ($593 million), Specialty Care and Oncology operating segment ($220 million), Established Products and Emerging
Markets operating segment ($110 million), Animal Health operating segment ($45 million), Consumer Healthcare operating segment ($8 million),
research and development operations ($490 million), manufacturing operations ($287 million) and Corporate ($422 million).
The restructuring charges in 2010 are associated with the following:
• Primary Care operating segment ($71 million), Specialty Care and Oncology operating segment ($197 million), Established Products and Emerging
Markets operating segment ($43 million), Animal Health operating segment ($34 million), Consumer Healthcare operating segment ($12 million),
research and development operations ($297 million), manufacturing operations ($1.1 billion) and Corporate ($350 million).