Pfizer 2012 Annual Report Download - page 40
Download and view the complete annual report
Please find page 40 of the 2012 Pfizer annual report below. You can navigate through the pages in the report by either clicking on the pages listed below, or by using the keyword search tool below to find specific information within the annual report.-
 1
1 -
2
-
3
-
4
-
5
-
6
-
7
-
8
-
9
-
10
-
11
-
12
-
13
-
14
-
15
-
16
-
17
-
18
-
19
-
20
-
21
-
22
-
23
-
24
-
25
-
26
-
27
-
28
-
29
-
 30
30 -
 31
31 -
 32
32 -
 33
33 -
 34
34 -
 35
35 -
 36
36 -
 37
37 -
 38
38 -
 39
39 -
 40
40 -
 41
41 -
 42
42 -
 43
43 -
 44
44 -
 45
45 -
 46
46 -
 47
47 -
 48
48 -
 49
49 -
 50
50 -
51
-
52
-
53
-
54
-
55
-
56
-
57
-
58
-
59
-
60
-
61
-
62
-
63
-
64
-
65
-
66
-
67
-
68
-
69
-
70
-
71
-
72
-
73
-
74
-
75
-
76
-
77
-
78
-
79
-
80
-
81
-
82
-
83
-
84
-
85
-
86
-
87
-
88
-
89
-
90
-
91
-
92
-
93
-
94
-
95
-
96
-
97
-
98
-
99
-
100
-
101
-
102
-
103
-
104
-
105
-
106
-
107
-
108
-
109
-
110
-
111
-
112
-
113
-
114
-
115
-
116
-
117
-
118
-
119
-
120
-
121
 |
 |

Financial Review
Pfizer Inc. and Subsidiary Companies
2012 Financial Report
39
For Pension benefit obligations and Postretirement benefit obligations, the changes also reflect the lowering of the discount rate, partially
offset by the impact of $938 million of company contributions (see Notes to Consolidated Financial Statements—Note 11. Pension and
Postretirement Benefit Plans and Defined Contribution Plans).
For Other taxes payable, the change also reflects the impact of a number of audit settlements (see Notes to Consolidated Financial
Statements—Note 5A. Tax Matters: Taxes on Income from Continuing Operations).
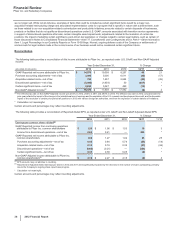
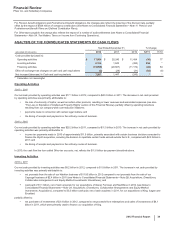
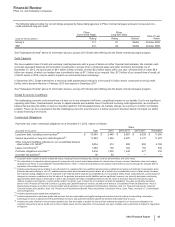
ANALYSIS OF THE CONSOLIDATED STATEMENTS OF CASH FLOWS
Year Ended December 31, % Change
(MILLIONS OF DOLLARS) 2012 2011 2010 12/11 11/10
Cash provided by/(used in):
Operating activities $17,054 $20,240 $11,454 (16)77
Investing activities 6,154 1,843 (492)234 *
Financing activities (15,999) (20,607) (11,174) (22)84
Effect of exchange-rate changes on cash and cash equivalents (2) (29)(31)(93)(6)
Net increase/(decrease) in Cash and cash equivalents 7,207 1,447 (243)**
* Calculation not meaningful.
Operating Activities
2012 v. 2011
Our net cash provided by operating activities was $17.1 billion in 2012, compared to $20.2 billion in 2011. The decrease in net cash provided
by operating activities was primarily attributable to:
• the loss of exclusivity of Lipitor, as well as certain other products, resulting in lower revenues and associated expenses (see also
“The Loss or Expiration of Intellectual Property Rights” section of this Financial Review), partially offset by spending reductions
resulting from our company-wide cost-reduction initiatives;
• payments made in connection with certain legal matters; and
• the timing of receipts and payments in the ordinary course of business.
2011 v. 2010
Our net cash provided by operating activities was $20.2 billion in 2011, compared to $11.5 billion in 2010. The increase in net cash provided by
operating activities was primarily attributable to:
• income tax payments made in 2010 of approximately $11.8 billion, primarily associated with certain business decisions executed to
finance the Wyeth acquisition, including the decision to repatriate certain funds earned outside the U.S., compared with $2.9 billion in
2011; and
• the timing of receipts and payments in the ordinary course of business.
In 2010, the cash flow line item called Other tax accounts, net, reflects the $11.8 billion tax payment described above.
Investing Activities
2012 v. 2011
Our net cash provided by investing activities was $6.2 billion in 2012, compared to $1.8 billion in 2011. The increase in net cash provided by
investing activities was primarily attributable to:
• net proceeds from the sale of our Nutrition business of $11.85 billion in 2012 compared to net proceeds from the sale of our
Capsugel business of $2.4 billion in 2011 (see Notes to Consolidated Financial Statements––Note 2B. Acquisitions, Divestitures,
Collaborative Arrangements and Equity-Method Investments: Divestitures); and
•cash paid of $1.1 billion, net of cash acquired, for our acquisitions of Alacer, Ferrosan and NextWave in 2012 (see Notes to
Consolidated Financial Statements––Note 2A. Acquisitions, Divestitures, Collaborative Arrangements and Equity-Method
Investments: Acquisitions), compared to $3.3 billion cash paid, net of cash acquired, in 2011, for our acquisitions of King, Icagen and
Excaliard,
partially offset by:
• net purchases of investments of $3.4 billion in 2012, compared to net proceeds from redemptions and sales of investments of $4.1
billion in 2011, which were primarily used to finance our acquisition of King.