Symantec 2016 Annual Report Download - page 124
Download and view the complete annual report
Please find page 124 of the 2016 Symantec annual report below. You can navigate through the pages in the report by either clicking on the pages listed below, or by using the keyword search tool below to find specific information within the annual report.-
 1
1 -
2
-
3
-
4
-
5
-
6
-
7
-
8
-
9
-
10
-
11
-
12
-
13
-
14
-
15
-
16
-
17
-
18
-
19
-
20
-
21
-
22
-
23
-
24
-
25
-
26
-
27
-
28
-
29
-
30
-
31
-
32
-
33
-
34
-
35
-
36
-
37
-
38
-
39
-
40
-
41
-
42
-
43
-
44
-
45
-
46
-
47
-
48
-
49
-
50
-
51
-
52
-
53
-
54
-
55
-
56
-
57
-
58
-
59
-
60
-
61
-
62
-
63
-
64
-
65
-
66
-
67
-
68
-
69
-
70
-
71
-
72
-
73
-
74
-
75
-
76
-
77
-
78
-
79
-
80
-
81
-
82
-
83
-
84
-
85
-
86
-
87
-
88
-
89
-
90
-
91
-
92
-
93
-
94
-
95
-
96
-
97
-
98
-
99
-
100
-
101
-
102
-
103
-
104
-
105
-
106
-
107
-
108
-
109
-
110
-
111
-
112
-
113
-
 114
114 -
 115
115 -
 116
116 -
 117
117 -
 118
118 -
 119
119 -
 120
120 -
 121
121 -
 122
122 -
 123
123 -
 124
124 -
 125
125 -
 126
126 -
 127
127 -
 128
128 -
 129
129 -
 130
130 -
 131
131 -
 132
132 -
 133
133 -
 134
134 -
135
-
136
-
137
-
138
-
139
-
140
-
141
-
142
-
143
-
144
-
145
-
146
-
147
-
148
-
149
-
150
-
151
-
152
-
153
-
154
-
155
-
156
-
157
-
158
-
159
-
160
-
161
-
162
-
163
-
164
-
165
-
166
-
167
-
168
-
169
-
170
-
171
-
172
-
173
-
174
-
175
-
176
-
177
-
178
-
179
-
180
-
181
-
182
-
183
-
184
 |
 |

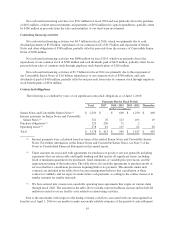
RESULTS OF OPERATIONS
The following table sets forth certain Consolidated Statements of Operations data as a percentage of net
revenues for the fiscal years indicated below:
2016 2015 2014
Net revenues 100% 100% 100%
Cost of revenues 17% 18% 19%
Gross profit 83% 82% 81%
Operating expenses:
Sales and marketing 36% 42% 42%
Research and development 21% 21% 17%
General and administrative 8% 9% 10%
Amortization of intangible assets 2% 2% 2%
Restructuring, separation, and transition 4% 4% 6%
Total operating expenses 70% 78% 78%
Operating income 13% 4% 3%
Non-operating expense, net 2% 1% 1%
The total percentages may not add due to rounding.
Net revenues by fiscal year
Change in %
2016 2015 2014 2016 v 2015 2015 v 2014
(Dollars in millions)
Net revenues $ 3,600 $ 3,956 $ 4,183 (9)% (5)%
2016 compared to 2015
Net revenues decreased $356 million year over year primarily due to unfavorable foreign currency
fluctuations of $171 million and declines in our consumer security revenue driven by the ongoing impact of
changes to our renewal practices and a reduction in revenue from OEM arrangements. In addition, net revenues
decreased partially due to the impact of the additional week from the 53-week fiscal 2015 year.
2015 compared to 2014
Net revenues decreased $227 million primarily due to declines in our consumer security products driven by
our channel strategy to exit unprofitable retail arrangements and certain high-cost OEM arrangements, coupled
with the impact to change our renewal practices. In addition, net revenues decreased due to the general
strengthening of the U.S. dollar against foreign currencies and weakness in endpoint management, partially offset
by the impact of the additional week from the 53-week fiscal 2015 year.
36