Symantec 2016 Annual Report Download - page 3
Download and view the complete annual report
Please find page 3 of the 2016 Symantec annual report below. You can navigate through the pages in the report by either clicking on the pages listed below, or by using the keyword search tool below to find specific information within the annual report.-
 1
1 -
 2
2 -
 3
3 -
 4
4 -
 5
5 -
 6
6 -
 7
7 -
 8
8 -
 9
9 -
 10
10 -
 11
11 -
 12
12 -
 13
13 -
 14
14 -
15
-
16
-
17
-
18
-
19
-
20
-
21
-
22
-
23
-
24
-
25
-
26
-
27
-
28
-
29
-
30
-
31
-
32
-
33
-
34
-
35
-
36
-
37
-
38
-
39
-
40
-
41
-
42
-
43
-
44
-
45
-
46
-
47
-
48
-
49
-
50
-
51
-
52
-
53
-
54
-
55
-
56
-
57
-
58
-
59
-
60
-
61
-
62
-
63
-
64
-
65
-
66
-
67
-
68
-
69
-
70
-
71
-
72
-
73
-
74
-
75
-
76
-
77
-
78
-
79
-
80
-
81
-
82
-
83
-
84
-
85
-
86
-
87
-
88
-
89
-
90
-
91
-
92
-
93
-
94
-
95
-
96
-
97
-
98
-
99
-
100
-
101
-
102
-
103
-
104
-
105
-
106
-
107
-
108
-
109
-
110
-
111
-
112
-
113
-
114
-
115
-
116
-
117
-
118
-
119
-
120
-
121
-
122
-
123
-
124
-
125
-
126
-
127
-
128
-
129
-
130
-
131
-
132
-
133
-
134
-
135
-
136
-
137
-
138
-
139
-
140
-
141
-
142
-
143
-
144
-
145
-
146
-
147
-
148
-
149
-
150
-
151
-
152
-
153
-
154
-
155
-
156
-
157
-
158
-
159
-
160
-
161
-
162
-
163
-
164
-
165
-
166
-
167
-
168
-
169
-
170
-
171
-
172
-
173
-
174
-
175
-
176
-
177
-
178
-
179
-
180
-
181
-
182
-
183
-
184
 |
 |

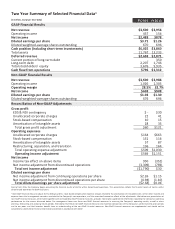
Two Year Summary of Selected Financial Data1
(In millions, except per share data)
FY2016 FY2015
GAAP Financial Results
Net revenue $3,600 $3,956
Operating income 457 154
Net income $2,488 $878
Diluted earnings per share $3.71 $1.26
Diluted weighted-average shares outstanding 670 696
Cash position (including short-term investments) $6,025 $3,860
Total assets 11,767 13,233
Deferred revenue $2,638 $2,871
Current portion of long-term debt - 350
Long-term debt 2,207 1,746
Total stockholders' equity 3,676 5,935
Cash flow from operations $796 $1,312
Non-GAAP Financial Results
Net revenue $3,600 $3,986
Operating income 1,026 1,305
Operating margin 28.5% 32.7%
Net income $698 $908
Diluted earnings per share $1.03 $1.30
Diluted weighted-average shares outstanding 676 696
Reconciliation of Non-GAAP Adjustments
Gross profit
EDS & NDI contingency $ - $30
Unallocated corporate charges 22 41
Stock-based compensation 10 15
Amortization of intangible assets 28 35
Total gross profit adjustment $60 $121
Operating expenses
Unallocated corporate charges $164 $663
Stock-based compensation 151 116
Amortization of intangible assets 57 87
Restructuring, separation, and transition 136 164
Total operating expense adjustment $509 $1,030
Operating income adjustment $569 $1,151
Net income
Income tax effect on above items 950 (352)
Net income adjustment from discontinued operations (3,309) (769)
Total net Income adjustment ($1,790) $30
Diluted earnings per share
Net income adjustment from continuing operations per share $2.26 $1.15
Net income adjustment from discontinued operations per share (4.94) (1.10)
Total diluted earnings per share adjustment ($2.68) $0.04
During fiscal 2016, the Company began presenting the financial results of Veritas within discontinued operations. This presentation reflects the financial results of Veritas within
discontinued operations for both fiscal years.
1Non-GAAP financial measures adjust for the following items: stock-based compensation expense; charges related to the amortization of intangible assets; certain other income and
expense items that management considers unrelated to the Company’s core operations; and the associated income tax effects of the adjustments. We believe our presentation of
non-GAAP financial measures, when taken together with corresponding GAAP financial measures, provides meaningful supplemental information regarding the Company’s operating
performance for the reasons discussed below. Our management team uses these non-GAAP financial measures in assessing the Company’s operating results, as well as when
planning, forecasting and analyzing future periods. We believe that these non-GAAP financial measures also facilitate comparisons of the Company’s performance to prior periods
and to our peers and that investors benefit from an understanding of the non-GAAP financial measures. Non-GAAP financial measures are supplemental and should not be
considered a substitute for financial information presented in accordance with GAAP.