Symantec 2016 Annual Report Download - page 128
Download and view the complete annual report
Please find page 128 of the 2016 Symantec annual report below. You can navigate through the pages in the report by either clicking on the pages listed below, or by using the keyword search tool below to find specific information within the annual report.-
 1
1 -
2
-
3
-
4
-
5
-
6
-
7
-
8
-
9
-
10
-
11
-
12
-
13
-
14
-
15
-
16
-
17
-
18
-
19
-
20
-
21
-
22
-
23
-
24
-
25
-
26
-
27
-
28
-
29
-
30
-
31
-
32
-
33
-
34
-
35
-
36
-
37
-
38
-
39
-
40
-
41
-
42
-
43
-
44
-
45
-
46
-
47
-
48
-
49
-
50
-
51
-
52
-
53
-
54
-
55
-
56
-
57
-
58
-
59
-
60
-
61
-
62
-
63
-
64
-
65
-
66
-
67
-
68
-
69
-
70
-
71
-
72
-
73
-
74
-
75
-
76
-
77
-
78
-
79
-
80
-
81
-
82
-
83
-
84
-
85
-
86
-
87
-
88
-
89
-
90
-
91
-
92
-
93
-
94
-
95
-
96
-
97
-
98
-
99
-
100
-
101
-
102
-
103
-
104
-
105
-
106
-
107
-
108
-
109
-
110
-
111
-
112
-
113
-
114
-
115
-
116
-
117
-
 118
118 -
 119
119 -
 120
120 -
 121
121 -
 122
122 -
 123
123 -
 124
124 -
 125
125 -
 126
126 -
 127
127 -
 128
128 -
 129
129 -
 130
130 -
 131
131 -
 132
132 -
 133
133 -
 134
134 -
 135
135 -
 136
136 -
 137
137 -
 138
138 -
139
-
140
-
141
-
142
-
143
-
144
-
145
-
146
-
147
-
148
-
149
-
150
-
151
-
152
-
153
-
154
-
155
-
156
-
157
-
158
-
159
-
160
-
161
-
162
-
163
-
164
-
165
-
166
-
167
-
168
-
169
-
170
-
171
-
172
-
173
-
174
-
175
-
176
-
177
-
178
-
179
-
180
-
181
-
182
-
183
-
184
 |
 |

The $90 million increase in research and development expense for fiscal 2015 was primarily due to higher
unallocated corporate charges and stock-based compensation expense.
General and administrative expenses decreased $58 million primarily due to a reduction of unallocated
corporate charges of $17 million.
Amortization of intangible assets decreased by $6 million primarily as a result of certain intangible assets
becoming fully amortized during fiscal 2015.
Restructuring, separation, and transition costs include severance, facilities, separation, transition and other
related costs. For fiscal 2015, we incurred $101 million of restructuring costs, $23 million in separation costs,
and $40 million in transition costs. For further information on restructuring and transition costs, see Note 6 of the
Notes to Consolidated Financial Statements in this annual report.
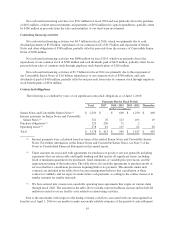
Non-operating expense, net by fiscal year
Change in %
2016 2015 2014 2016 v 2015 2015 v 2014
(Dollars in millions)
Interest income $ 10 $ 11 $ 11 (9)% -%
Interest expense (75) (78) (84) (4)% (7)%
Other income, net - 14 36 * *
Non-operating expense, net $ (65) $ (53) $ (37) 23% 43%
* Percentage is not meaningful.
2016 compared to 2015
Non-operating expense, net, increased $12 million primarily due to net foreign currency remeasurement
losses.
2015 compared to 2014
Non-operating expense, net, increased $16 million primarily due to a $32 million realized gain from sale of
short-term investments during fiscal 2014, offset by favorable foreign currency effects and a reduction in interest
expense.
Provision for income taxes by fiscal year
Change in %
2016 2015 2014 2016 v 2015 2015 v 2014
(Dollars in millions)
Income from continuing operations before income
taxes $ 392 $ 101 $ 107 288% (6)%
Provision for (benefit from) income taxes $ 1,213 $ (8) $ 16 * *
Effective tax rate on continuing operations income 309% (8)% 15%
* Percentage is not meaningful.
We recorded an income tax expense on discontinued operations of $1.1 billion, $223 million and $242
million for fiscal 2016, 2015 and 2014, respectively. See Note 3 of the Notes to Consolidated Financial
Statements in this annual report for additional information.
40