Symantec 2016 Annual Report Download - page 133
Download and view the complete annual report
Please find page 133 of the 2016 Symantec annual report below. You can navigate through the pages in the report by either clicking on the pages listed below, or by using the keyword search tool below to find specific information within the annual report.-
 1
1 -
2
-
3
-
4
-
5
-
6
-
7
-
8
-
9
-
10
-
11
-
12
-
13
-
14
-
15
-
16
-
17
-
18
-
19
-
20
-
21
-
22
-
23
-
24
-
25
-
26
-
27
-
28
-
29
-
30
-
31
-
32
-
33
-
34
-
35
-
36
-
37
-
38
-
39
-
40
-
41
-
42
-
43
-
44
-
45
-
46
-
47
-
48
-
49
-
50
-
51
-
52
-
53
-
54
-
55
-
56
-
57
-
58
-
59
-
60
-
61
-
62
-
63
-
64
-
65
-
66
-
67
-
68
-
69
-
70
-
71
-
72
-
73
-
74
-
75
-
76
-
77
-
78
-
79
-
80
-
81
-
82
-
83
-
84
-
85
-
86
-
87
-
88
-
89
-
90
-
91
-
92
-
93
-
94
-
95
-
96
-
97
-
98
-
99
-
100
-
101
-
102
-
103
-
104
-
105
-
106
-
107
-
108
-
109
-
110
-
111
-
112
-
113
-
114
-
115
-
116
-
117
-
118
-
119
-
120
-
121
-
122
-
 123
123 -
 124
124 -
 125
125 -
 126
126 -
 127
127 -
 128
128 -
 129
129 -
 130
130 -
 131
131 -
 132
132 -
 133
133 -
 134
134 -
 135
135 -
 136
136 -
 137
137 -
 138
138 -
 139
139 -
 140
140 -
 141
141 -
 142
142 -
 143
143 -
144
-
145
-
146
-
147
-
148
-
149
-
150
-
151
-
152
-
153
-
154
-
155
-
156
-
157
-
158
-
159
-
160
-
161
-
162
-
163
-
164
-
165
-
166
-
167
-
168
-
169
-
170
-
171
-
172
-
173
-
174
-
175
-
176
-
177
-
178
-
179
-
180
-
181
-
182
-
183
-
184
 |
 |

Net cash used in investing activities was $517 million for fiscal 2014 and was primarily due to the purchase
of $492 million, of short-term investments and payments of $194 million for capital expenditures, partially offset
by $186 million in proceeds from the sales and maturities of our short-term investments.
Continuing financing activities
Net cash used in financing activities was $4.7 billion for fiscal 2016, which was primarily due to cash
dividend payments of $3.0 billion, repurchases of our common stock of $1.9 billion and repayment of Senior
Notes and other obligations of $368 million, partially offset by proceeds from the issuance of Convertible Senior
Notes of $500 million.
Net cash used in financing activities was $800 million for fiscal 2015, which was primarily due to the
repurchases of our common stock of $500 million and cash dividends paid of $413 million, partially offset by net
proceeds from sales of common stock through employee stock benefit plans of $116 million.
Net cash used in financing activities of $1.7 billion for fiscal 2014 was primarily due to the repayment of
our Convertible Senior Notes of $1.0 billion, repurchases of our common stock of $500 million, and cash
dividends of paid of $418 million, partially offset by net proceeds from sales of common stock through employee
stock benefit plans of $234 million.
Contractual obligations
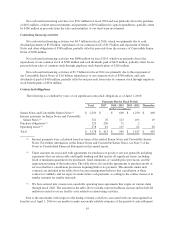
The following is a schedule by years of our significant contractual obligations as of April 1, 2016:
Payments Due by Fiscal Period
Total 2017 2018 - 2019 2020 - 2021 Thereafter
(Dollars in millions)
Senior Notes and Convertible Senior Notes (1) $ 2,250 $ - $ 600 $ 1,250 $ 400
Interest payments on Senior Notes and Convertible
Senior Notes (1) 321 76 123 103 19
Purchase obligations (2) 329 256 71 2 -
Operating leases (3) 278 81 115 62 20
Total $ 3,178 $ 413 $ 909 $ 1,417 $ 439
(1) Interest payments were calculated based on terms of the related Senior Notes and Convertible Senior
Notes. For further information on the Senior Notes and Convertible Senior Notes, see Note 5 of the
Notes to Consolidated Financial Statements in this annual report.
(2) These amounts are associated with agreements for purchases of goods or services generally including
agreements that are enforceable and legally binding and that specify all significant terms, including
fixed or minimum quantities to be purchased; fixed, minimum, or variable price provisions; and the
approximate timing of the transaction. The table above also includes agreements to purchase goods or
services that have cancellation provisions requiring little or no payment. The amounts under such
contracts are included in the table above because management believes that cancellation of these
contracts is unlikely and we expect to make future cash payments according to the contract terms or in
similar amounts for similar materials.
(3) We have entered into various non-cancelable operating lease agreements that expire on various dates
through fiscal 2026. The amounts in the table above exclude expected sublease income and include $8
million in exited or excess facility costs related to restructuring activities.
Due to the uncertainty with respect to the timing of future cash flows associated with our unrecognized tax
benefits as of April 1, 2016 we are unable to make reasonably reliable estimates of the period of cash settlement
45