Symantec 2016 Annual Report Download - page 126
Download and view the complete annual report
Please find page 126 of the 2016 Symantec annual report below. You can navigate through the pages in the report by either clicking on the pages listed below, or by using the keyword search tool below to find specific information within the annual report.-
 1
1 -
2
-
3
-
4
-
5
-
6
-
7
-
8
-
9
-
10
-
11
-
12
-
13
-
14
-
15
-
16
-
17
-
18
-
19
-
20
-
21
-
22
-
23
-
24
-
25
-
26
-
27
-
28
-
29
-
30
-
31
-
32
-
33
-
34
-
35
-
36
-
37
-
38
-
39
-
40
-
41
-
42
-
43
-
44
-
45
-
46
-
47
-
48
-
49
-
50
-
51
-
52
-
53
-
54
-
55
-
56
-
57
-
58
-
59
-
60
-
61
-
62
-
63
-
64
-
65
-
66
-
67
-
68
-
69
-
70
-
71
-
72
-
73
-
74
-
75
-
76
-
77
-
78
-
79
-
80
-
81
-
82
-
83
-
84
-
85
-
86
-
87
-
88
-
89
-
90
-
91
-
92
-
93
-
94
-
95
-
96
-
97
-
98
-
99
-
100
-
101
-
102
-
103
-
104
-
105
-
106
-
107
-
108
-
109
-
110
-
111
-
112
-
113
-
114
-
115
-
 116
116 -
 117
117 -
 118
118 -
 119
119 -
 120
120 -
 121
121 -
 122
122 -
 123
123 -
 124
124 -
 125
125 -
 126
126 -
 127
127 -
 128
128 -
 129
129 -
 130
130 -
 131
131 -
 132
132 -
 133
133 -
 134
134 -
 135
135 -
 136
136 -
137
-
138
-
139
-
140
-
141
-
142
-
143
-
144
-
145
-
146
-
147
-
148
-
149
-
150
-
151
-
152
-
153
-
154
-
155
-
156
-
157
-
158
-
159
-
160
-
161
-
162
-
163
-
164
-
165
-
166
-
167
-
168
-
169
-
170
-
171
-
172
-
173
-
174
-
175
-
176
-
177
-
178
-
179
-
180
-
181
-
182
-
183
-
184
 |
 |

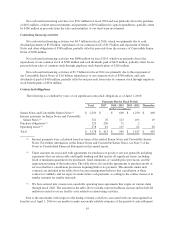
Net revenues by geographic region by fiscal year
Change in %
2016 2015 2014 2016 v 2015 2015 v 2014
(Dollars in millions)
Revenues by geographic region:
Americas (U.S., Canada and Latin
America) $ 2,113 $ 2,214 $ 2,315 (5)% (4)%
EMEA (Europe, Middle East and
Africa) 894 1,065 1,129 (16)% (6)%
APJ (Asia Pacific and Japan) 593 677 739 (12)% (8)%
Total net revenues $ 3,600 $ 3,956 $ 4,183
U.S. $ 1,897 $ 1,960 $ 2,049 (3)% (4)%
International 1,703 1,996 2,134 (15)% (6)%
Total net revenues $ 3,600 $ 3,956 $ 4,183
Percentage of total net revenues:
Americas (U.S., Canada and Latin
America) 59% 56% 55%
EMEA (Europe, Middle East and
Africa) 25% 27% 27%
APJ (Asia Pacific and Japan) 16% 17% 18%
U.S. 53% 50% 49%
International 47% 50% 51%
Fluctuations in the U.S. dollar compared to foreign currencies unfavorably impacted our international
revenue by approximately $171 million for fiscal 2016 as compared to fiscal 2015. Fiscal 2016 revenue for the
EMEA and APJ regions decreased primarily due to unfavorable foreign currency fluctuations of $119 million
and $49 million, respectively, compared to fiscal 2015.
Fluctuations in the U.S. dollar compared to foreign currencies unfavorably impacted our international
revenue by approximately $92 million for fiscal 2015 as compared to fiscal 2014. This was due to unfavorable
foreign currency fluctuations of $53 million in the EMEA region and $39 million in the APJ region.
Our international sales are expected to continue to be a significant portion of our revenue. As a result,
revenue is expected to continue to be affected by foreign currency exchange rates as compared to the U.S. dollar.
We are unable to predict the extent to which revenue in future periods will be impacted by changes in foreign
currency exchange rates. If international sales become a greater portion of our total sales in the future, changes in
foreign currency exchange rates may have a potentially greater impact on our revenue and operating results.
Cost of revenues by fiscal year
Change in %
2016 2015 2014 2016 v 2015 2015 v 2014
(Dollars in millions)
Cost of revenues $ 615 $ 727 $ 791 (15)% (8)%
2016 compared to 2015
Cost of revenues consists primarily of technical support costs, costs of billable services, and fees to OEMs
under revenue-sharing agreements. Our cost of revenues decreased $112 million for fiscal 2016 compared to
fiscal 2015 primarily due to favorable currency effects, a decrease in OEM royalty fees, and a decrease in service
related and content delivery expenses.
38