Symantec 2016 Annual Report Download - page 132
Download and view the complete annual report
Please find page 132 of the 2016 Symantec annual report below. You can navigate through the pages in the report by either clicking on the pages listed below, or by using the keyword search tool below to find specific information within the annual report.-
 1
1 -
2
-
3
-
4
-
5
-
6
-
7
-
8
-
9
-
10
-
11
-
12
-
13
-
14
-
15
-
16
-
17
-
18
-
19
-
20
-
21
-
22
-
23
-
24
-
25
-
26
-
27
-
28
-
29
-
30
-
31
-
32
-
33
-
34
-
35
-
36
-
37
-
38
-
39
-
40
-
41
-
42
-
43
-
44
-
45
-
46
-
47
-
48
-
49
-
50
-
51
-
52
-
53
-
54
-
55
-
56
-
57
-
58
-
59
-
60
-
61
-
62
-
63
-
64
-
65
-
66
-
67
-
68
-
69
-
70
-
71
-
72
-
73
-
74
-
75
-
76
-
77
-
78
-
79
-
80
-
81
-
82
-
83
-
84
-
85
-
86
-
87
-
88
-
89
-
90
-
91
-
92
-
93
-
94
-
95
-
96
-
97
-
98
-
99
-
100
-
101
-
102
-
103
-
104
-
105
-
106
-
107
-
108
-
109
-
110
-
111
-
112
-
113
-
114
-
115
-
116
-
117
-
118
-
119
-
120
-
121
-
 122
122 -
 123
123 -
 124
124 -
 125
125 -
 126
126 -
 127
127 -
 128
128 -
 129
129 -
 130
130 -
 131
131 -
 132
132 -
 133
133 -
 134
134 -
 135
135 -
 136
136 -
 137
137 -
 138
138 -
 139
139 -
 140
140 -
 141
141 -
 142
142 -
143
-
144
-
145
-
146
-
147
-
148
-
149
-
150
-
151
-
152
-
153
-
154
-
155
-
156
-
157
-
158
-
159
-
160
-
161
-
162
-
163
-
164
-
165
-
166
-
167
-
168
-
169
-
170
-
171
-
172
-
173
-
174
-
175
-
176
-
177
-
178
-
179
-
180
-
181
-
182
-
183
-
184
 |
 |

In May 2016, the Board of Directors approved a fiscal 2017 restructuring plan. See Note 13 of the Notes to
the Consolidated Financial Statements in this annual report for more information.
Note Repayment. In the second quarter of fiscal 2016, the principal balance of our 2.75% Senior Notes due
September 15, 2015 matured and was settled by a cash payment of $350 million, along with the $5 million
semiannual interest payment.
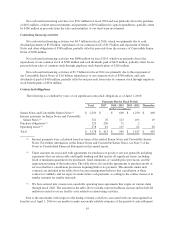
Cash flows
The following table summarizes, for the fiscal periods indicated, selected items in our Consolidated
Statements of Cash Flows:
2016 2015 2014
(Dollars in millions)
Net cash provided by (used in) from continuing operations:
Operating activities $ 1,456 $ 17 $ 108
Investing activities 7,236 (1,076) (517)
Financing activities (4,734) (800) (1,700)
Continuing operating activities
We expect cash from our operating activities to fluctuate in future periods as a result of a number of factors,
including the timing of our billings and collections, our operating results, the timing and amount of tax and other
liability payments.
Net cash provided by operating activities was $1.5 billion for fiscal 2016 due to increases in deferred
income taxes of $1.1 billion and income taxes payable of $693 million. These amounts were partially offset by a
loss from continuing operations, net of income taxes of $821 million, including non-cash items depreciation and
amortization charges of $304 million and stock-based compensation expense of $161 million.
Net cash provided by operating activities was $17 million for fiscal 2015, which resulted from income from
continuing operations, net of income taxes of $109 million adjusted for non-cash items, including depreciation
and amortization charges of $355 million and stock-based compensation expense of $131 million. These amounts
were partially offset by decreases in income taxes payable of $405 million, deferred revenue of $83 million, and
accounts payable of $73 million.
Net cash provided by operating activities was $108 million for fiscal 2014, which resulted from net income
from continuing operations of $91 million adjusted for non-cash items, including depreciation and amortization
charges of $374 million and stock-based compensation expense of $105 million. These amounts were partially
offset by decreases in income taxes payable of $240 million, deferred revenue of $161 million, and accrued
compensation and benefits of $83 million.
Continuing investing activities
Net cash provided by investing activities was $7.2 billion for fiscal 2016 and was primarily due to net
proceeds of $6.5 billion from the divestiture of Veritas and proceeds of $1.4 billion from maturities and sales of
short-term investments, partially offset by purchases of $378 million of short-term investments and payments of
$272 million for capital expenditures.
Net cash used in investing activities was $1.1 billion for fiscal 2015 and was primarily due to $1.8 billion in
purchases of short-term investments, and payments of $303 million for capital expenditures, partially offset by
$1.0 billion in proceeds from the sales and maturities of our short-term investments.
44