Walgreens 2010 Annual Report Download - page 19
Download and view the complete annual report
Please find page 19 of the 2010 Walgreens annual report below. You can navigate through the pages in the report by either clicking on the pages listed below, or by using the keyword search tool below to find specific information within the annual report.-
 1
1 -
2
-
3
-
4
-
5
-
6
-
7
-
8
-
 9
9 -
 10
10 -
 11
11 -
 12
12 -
 13
13 -
 14
14 -
 15
15 -
 16
16 -
 17
17 -
 18
18 -
 19
19 -
 20
20 -
 21
21 -
 22
22 -
 23
23 -
 24
24 -
 25
25 -
 26
26 -
 27
27 -
 28
28 -
 29
29 -
30
-
31
-
32
-
33
-
34
-
35
-
36
-
37
-
38
-
39
-
40
-
41
-
42
-
43
-
44
 |
 |

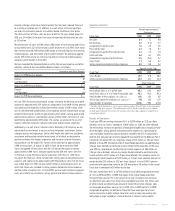
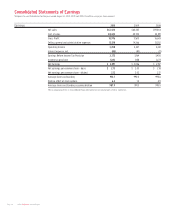
Five-Year Summary of Selected Consolidated Financial Data
Walgreen Co. and Subsidiaries (Dollars in millions, except per share and location amounts)
Fiscal Year 2010 (1) 2009 2008 2007 2006
Net Sales $ 67,420 $ 63,335 $ 59,034 $ 53,762 $ 47,409
Cost of sales (2) 48,444 45,722 42,391 38,518 34,240
Gross profit 18,976 17,613 16,643 15,244 13,169
Selling, general and administrative (2) (3) 15,518 14,366 13,202 12,093 10,467
Operating income 3,458 3,247 3,441 3,151 2,702
Other income (expense) (85) (83) (11) 38 52
Earnings Before Income Tax Provision (4) 3,373 3,164 3,430 3,189 2,754
Income tax provision 1,282 1,158 1,273 1,148 1,003
Net Earnings $ 2,091 $ 2,006 $ 2,157 $ 2,041 $ 1,751
Per Common Share Net earnings
Basic $ 2.13 $ 2.03 $ 2.18 $ 2.04 $ 1.73
Diluted 2.12 2.02 2.17 2.03 1.72
Dividends declared .59 .48 .40 .33 .27
Book value 15.34 14.54 13.01 11.20 10.04
Non-Current Liabilities Long-term debt $ 2,389 $ 2,336 $ 1,337 $ 22 $ 3
Deferred income taxes 318 265 150 158 141
Other non-current liabilities 1,735 1,396 1,410 1,285 1,116
Assets and Equity Total assets $ 26,275 $ 25,142 $ 22,410 $ 19,314 $ 17,131
Shareholders’ equity 14,400 14,376 12,869 11,104 10,116
Return on average shareholders’ equity 14.5% 14.7% 18.0% 19.2% 18.4%
Locations Year-end (5) 8,046 7,496 6,934 5,997 5,461
(1) Includes results of Duane Reade operations since the April 9, 2010 acquisition date.
(2) Fiscal 2010 and 2009 included Rewiring for Growth pre-tax restructuring and restructuring related charges of $106 million ($.07 per share, diluted)
and $252 million ($.16 per share, diluted), respectively. These charges, included in cost of sales and selling, general and administrative expenses
for fiscal 2010 and 2009, were $40 million and $95 million, and $66 million and $157 million, respectively. Fiscal 2010 and 2009 included pre-tax
expenses related to Customer Centric Retailing store conversions of $45 million and $5 million, respectively, all of which was included in selling,
general and administrative expenses.
(3) Fiscal 2008 included a positive pre-tax adjustment of $79 million ($.05 per share, diluted), which corrected for historically over-accruing the
Company’s vacation liability.
(4) Fiscal 2010 included a deferred tax charge of $43 million related to the repeal of a tax benefit for the Medicare Part D subsidy for retiree benefits.
(5) Locations include drugstores, worksite facilities, home care facilities, specialty pharmacies and mail service facilities.
2010 Walgreens Annual Report Page 17