Walgreens 2010 Annual Report Download - page 39
Download and view the complete annual report
Please find page 39 of the 2010 Walgreens annual report below. You can navigate through the pages in the report by either clicking on the pages listed below, or by using the keyword search tool below to find specific information within the annual report.-
 1
1 -
2
-
3
-
4
-
5
-
6
-
7
-
8
-
9
-
10
-
11
-
12
-
13
-
14
-
15
-
16
-
17
-
18
-
19
-
20
-
21
-
22
-
23
-
24
-
25
-
26
-
27
-
28
-
 29
29 -
 30
30 -
 31
31 -
 32
32 -
 33
33 -
 34
34 -
 35
35 -
 36
36 -
 37
37 -
 38
38 -
 39
39 -
 40
40 -
 41
41 -
 42
42 -
 43
43 -
 44
44
 |
 |

2010 Walgreens Annual Report Page 37
A summary of information relative to the Company’s restricted stock awards follows:
Weighted-Average
Nonvested Shares Shares Grant-Date Fair Value
Nonvested at August 31, 2009 186,279 $ 39.39
Granted — —
Forfeited (17,582) 41.09
Vested (71,987) 41.44
Nonvested at August 31, 2010 96,710 $ 37.53
A summary of information relative to the Company’s restricted stock unit plan follows:
Weighted-Average
Outstanding Shares Shares Grant-Date Fair Value
Outstanding at August 31, 2009 455,090 $ 34.72
Granted 768,957 34.28
Forfeited (56,945) 34.91
Vested (18,938) 35.80
Outstanding at August 31, 2010 1,148,164 $ 34.40
A summary of information relative to the Company’s performance share plan follows:
Weighted-Average
Outstanding Shares Shares Grant-Date Fair Value
Outstanding at August 31, 2009 450,548 $ 36.43
Granted 635,157 34.04
Forfeited (89,084) 35.13
Vested — —
Outstanding at August 31, 2010 996,621 $ 35.02
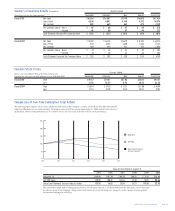
The fair value of each option grant was determined using the Black-Scholes option
pricing model with weighted-average assumptions used in fiscal 2010,
2009 and 2008:
2010 2009 2008
Risk-free interest rate (1) 3.14% 3.47% 4.41%
Average life of option (years) (2) 7.3 6.8 7.2
Volatility (3) 28.01% 34.00% 27.61%
Dividend yield (4) 1.91% 2.30% .81%
Weighted-average grant-date fair value
Granted at market price $9.80 $ 9.14 $ 16.11
(1) Represents the U.S. Treasury security rates for the expected term of the option.
(2) Represents the period of time that options granted are expected to be outstanding.
The Company analyzed separate groups of employees with similar exercise behavior
to determine the expected term.
(3) Volatility was based on historical and implied volatility of the Company’s common stock.
(4) Represents the Company’s cash dividend for the expected term.
13. Retirement Benefits
The principal retirement plan for employees is the Walgreen Profit-Sharing Retirement
Trust, to which both the Company and participating employees contribute. The
Company’s contribution, which has historically related to pre-tax income and a
portion of which is in the form of a guaranteed match, is determined annually
at the discretion of the Board of Directors. The profit-sharing provision was
$300 million in fiscal 2010, $282 million in fiscal 2009 and $305 million in fiscal
2008. The Company’s contributions were $293 million in fiscal 2010, $301 million
in fiscal 2009 and $261 million in fiscal 2008.
The Company provides certain health insurance benefits for retired employees
who meet eligibility requirements, including age, years of service and date of hire.
The costs of these benefits are accrued over the service life of the employee.
The postretirement health benefit plans are not funded. In May 2009, the postretirement
health benefit plans were amended to change eligibility requirements. As a result of
this amendment we recognized curtailment income of $16 million in fiscal 2009.
Additionally in fiscal 2009, the Company recognized a special retirement benefit
expense of $4 million related to accelerating eligibility for certain employees who
elected special early retirement as a part of its Rewiring for Growth program.
Components of net periodic benefit costs (In millions):
2010 2009 2008
Service cost $ 11 $ 12 $ 14
Interest cost 20 26 24
Amortization of actuarial loss 7 4 5
Amortization of prior service cost (10) (6) (4)
Special retirement benefit — 4 —
Curtailment gain — (16) —
Total postretirement benefit cost $ 28 $ 24 $ 39
Change in benefit obligation (In millions):
2010 2009
Benefit obligation at September 1 $ 328 $ 371
Service cost 11 12
Interest cost 20 26
Amendments — (106)
Special termination benefits — 4
Actuarial loss 92 31
Benefit payments (14) (13)
Participants contributions 4 3
Benefit obligation at August 31 $ 441 $ 328
Change in plan assets (In millions):
2010 2009
Plan assets at fair value at September 1 $ — $ —
Plan participants contributions 4 3
Employer contributions 10 10
Benefits paid (14) (13)
Plan assets at fair value at August 31 $ — $ —
Funded status (In millions):
2010 2009
Funded status $ (441) $ (328)
Unrecognized actuarial gain — —
Unrecognized prior service cost — —
Accrued benefit cost at August 31 $ (441) $ (328)
Amounts recognized in the Consolidated Balance Sheets (In millions):
2010 2009
Current liabilities (present value of expected
2011 net benefit payments) $ (11) $ (11)
Non-current liabilities (430) (317)
Net liability recognized at August 31 $ (441) $ (328)