Walgreens 2010 Annual Report Download - page 21
Download and view the complete annual report
Please find page 21 of the 2010 Walgreens annual report below. You can navigate through the pages in the report by either clicking on the pages listed below, or by using the keyword search tool below to find specific information within the annual report.-
 1
1 -
2
-
3
-
4
-
5
-
6
-
7
-
8
-
9
-
10
-
 11
11 -
 12
12 -
 13
13 -
 14
14 -
 15
15 -
 16
16 -
 17
17 -
 18
18 -
 19
19 -
 20
20 -
 21
21 -
 22
22 -
 23
23 -
 24
24 -
 25
25 -
 26
26 -
 27
27 -
 28
28 -
 29
29 -
 30
30 -
 31
31 -
32
-
33
-
34
-
35
-
36
-
37
-
38
-
39
-
40
-
41
-
42
-
43
-
44
 |
 |

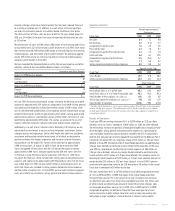
Operating Statistics
Percentage Increases/
(Decreases)
Fiscal Year 2010 2009 2008
Net Sales 6.4 7.3 9.8
Net Earnings 4.2 (7.0) 5.7
Comparable Drugstore Sales 1.6 2.0 4.0
Prescription Sales 6.3 7.8 9.7
Comparable Drugstore Prescription Sales 2.3 3.5 3.9
Front-End Sales 6.8 6.3 10.0
Comparable Drugstore Front-End Sales 0.5 (0.5) 4.2
Gross Profit 7.7 5.8 9.2
Selling, General and Administrative Expenses 8.0 8.8 9.2
Percent to Net Sales
Fiscal Year 2010 2009 2008
Gross Margin 28.1 27.8 28.2
Selling, General and Administrative Expenses 23.0 22.7 22.4
Other Statistics
Fiscal Year 2010 2009 2008
Prescription Sales as a % of Net Sales 65.2 65.3 64.9
Third Party Sales as a % of Total Prescription Sales 95.3 95.4 95.3
Total Number of Prescriptions (In millions) 695 651 617
30-Day Equivalent Prescriptions (In millions)* 778 723 677
Total Number of Locations 8,046 7,496 6,934
* Includes the adjustment to convert prescriptions greater than 84 days to the equivalent
of three 30-day prescriptions. This adjustment reflects the fact that these prescriptions
include approximately three times the amount of product days supplied compared to a
normal prescription.
Results of Operations
Fiscal year 2010 net earnings increased 4.2% to $2,091 million, or $2.12 per share
(diluted), versus last year’s earnings of $2,006 million, or $2.02 per share (diluted).
The net earnings increase was primarily attributable to higher gross margins partially
offset by higher selling, general and administrative expenses as a percentage of
sales and higher income tax expense primarily related to the ACA. In conjunction
with the ACA, one provision of which repealed the tax benefit for the Medicare Part D
subsidy for retiree benefits, we recorded a charge of $43 million, or $.04 per share
(diluted), in fiscal 2010. The dilutive effect of Duane Reade operations was approximately
$.06 per share (diluted), primarily due to costs related to the acquisition. In the fiscal
year 2010 we recorded pre-tax Rewiring for Growth expenses of $85 million, or
$.06 per share (diluted), and pre-tax margin dilution related to our Rewiring for
Growth activities of $21 million, or $.01 per share (diluted). This compares to pre-tax
Rewiring for Growth expenses of $220 million, or $.14 per share (diluted), and pre-tax
margin dilution $32 million, or $.02 per share (diluted), in fiscal 2009. Expenses
associated with converting stores to the CCR format were $45 million in the current
fiscal year as compared to $5 million a year ago.
Net sales increased by 6.4% to $67,420 million in fiscal 2010 compared to increases
of 7.3% in 2009 and 9.8% in 2008. The impact of the Duane Reade acquisition
increased total sales by 1.1% in the current fiscal year. Drugstore sales increases
resulted from sales gains in existing stores and added sales from new stores, each
of which include an indeterminate amount of market-driven price changes. Sales
in comparable drugstores were up 1.6% in 2010, 2.0% in 2009 and 4.0% in 2008.
Comparable drugstores are defined as those that have been open for at least
twelve consecutive months without closure for seven or more consecutive days
and without a major remodel or a natural disaster in the past twelve months.
Inventory charges relate to on-hand inventory that has been reduced from cost
to a selling price below cost. In addition, as a part of our restructuring efforts
we sold an incremental amount of inventory below traditional retail prices.
The dilutive effect of these sales on gross profit for the year ended August 31,
2010, was $21 million. In the prior fiscal year we reported a dilutive effect on sales
of $32 million.
We incurred pre-tax costs of $106 million ($85 million of restructuring and restruc-
turing related costs, $21 million of gross profit dilution) in fiscal 2010. Since incep-
tion, we have incurred $358 million ($305 million of restructuring and restructuring
related expenses, and $53 million of gross profit dilution). We anticipate approxi-
mately $50 million of pre-tax restructuring and restructuring related expenses
and gross profit dilution in fiscal 2011.
We have recorded the following balances within the accrued expenses and other
liabilities section of our Consolidated Balance Sheets (in millions):
Severance and Other Benefits
August 31, 2008 Reserve Balance $ —
Charges 82
Cash Payments (78)
August 31, 2009 Reserve Balance $ 4
Charges 19
Cash Payments (23)
August 31, 2010 Reserve Balance $ —
In fiscal 2010, we realized incremental savings related to the Rewiring for Growth
program of approximately $471 million as compared to fiscal 2009. Selling, general
and administrative expenses realized incremental savings of $391 million, while
cost of sales benefited by $80 million. Since inception, we have realized total savings
related to Rewiring for Growth of approximately $721 million. Selling, general and
administrative expenses realized total savings of $641 million, while cost of sales
benefited by approximately $80 million. The savings are primarily the result of
expense reduction initiatives, reduced store labor and personnel reductions.
Additionally, as a part of our Customer Centric Retailing (CCR) initiative, we are
enhancing the store format to ensure we have the proper assortments, better
category layouts and adjacencies, better shelf height and sight lines, and better
assortment and brand and private brand layout, all of which are designed to
positively enhance the shopper experience and increase customer frequency
and purchase size. We expect this format will be rolled out to approximately
5,500 existing stores. At August 31, 2010, in total, we have converted 1,469
stores and opened 345 new stores with the CCR format. We expect to convert
approximately 4,000 stores and open approximately 250 new stores with the
CCR format in fiscal 2011. Based on our experience with the first 1,469 stores,
we expect the total cost, which includes both selling, general and administrative
expenses and capital, to be approximately $50 thousand per store. For the fiscal
year ended August 31, 2010, we incurred $71 million in total program costs, of
which $45 million was included in selling, general and administrative expenses
and $26 million in capital costs. In fiscal 2009, we incurred $5 million in program
costs, all of which was included in selling, general and administrative expenses.
2010 Walgreens Annual Report Page 19