Walgreens 2010 Annual Report Download - page 40
Download and view the complete annual report
Please find page 40 of the 2010 Walgreens annual report below. You can navigate through the pages in the report by either clicking on the pages listed below, or by using the keyword search tool below to find specific information within the annual report.-
 1
1 -
2
-
3
-
4
-
5
-
6
-
7
-
8
-
9
-
10
-
11
-
12
-
13
-
14
-
15
-
16
-
17
-
18
-
19
-
20
-
21
-
22
-
23
-
24
-
25
-
26
-
27
-
28
-
29
-
 30
30 -
 31
31 -
 32
32 -
 33
33 -
 34
34 -
 35
35 -
 36
36 -
 37
37 -
 38
38 -
 39
39 -
 40
40 -
 41
41 -
 42
42 -
 43
43 -
 44
44
 |
 |

Page 38 2010 Walgreens Annual Report
Notes to Consolidated Financial Statements (continued)
Amounts recognized in accumulated other comprehensive (income) loss
(In millions):
2010 2009
Prior service credit $ (131) $ (141)
Net actuarial loss 188 104
Amounts expected to be recognized as components of net periodic costs
for fiscal year 2011 (In millions):
2011
Prior service credit $ (10)
Net actuarial loss 14
The measurement date used to determine postretirement benefits is August 31.
The discount rate assumption used to compute the postretirement benefit obli-
gation at year-end was 4.95% for 2010 and 6.15% for 2009. The discount rate
assumption used to determine net periodic benefit cost was 6.15%, 7.50% and
6.50% for fiscal years ending 2010, 2009 and 2008, respectively.
Future benefit costs were estimated assuming medical costs would increase at a
7.50% annual rate, gradually decreasing to 5.25% over the next nine years and
then remaining at a 5.25% annual growth rate thereafter. A one percentage point
change in the assumed medical cost trend rate would have the following effects
(In millions):
1% Increase 1% Decrease
Effect on service and interest cost $ (3) $ 2
Effect on postretirement obligation (22) 15
Estimated future benefit payments and federal subsidy (In millions):
Estimated Estimated
Future Benefit Federal
Payments Subsidy
2011 $ 13 $ 1
2012 14 1
2013 15 2
2014 17 2
2015 19 2
2016—2020 136 18
The expected benefit to be paid net of the estimated federal subsidy during fiscal
year 2011 is $12 million.
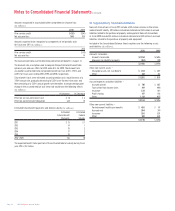
14. Supplementary Financial Information
Non-cash transactions in fiscal 2010 include a $95 million increase in the retiree
medical benefit liability, $29 million in dividends declared and $44 million in accrued
liabilities related to the purchase of property and equipment. Non-cash transactions
in fiscal 2009 include $25 million in dividends declared and $20 million in accrued
liabilities related to the purchase of property and equipment.
Included in the Consolidated Balance Sheets captions are the following assets
and liabilities (In millions):
2010 2009
Accounts receivable —
Accounts receivable $ 2,554 $ 2,606
Allowance for doubtful accounts (104) (110)
$ 2,450 $ 2,496
Other non-current assets —
Intangible assets, net (see Note 5) $ 1,114 $ 697
Other 168 133
$ 1,282 $ 830
Accrued expenses and other liabilities —
Accrued salaries $ 781 $ 687
Taxes other than income taxes 419 408
Insurance 233 164
Profit sharing 197 192
Other 1,133 955
$ 2,763 $ 2,406
Other non-current liabilities —
Postretirement health care benefits $ 430 $ 317
Accrued rent 384 319
Insurance 330 330
Other 591 430
$ 1,735 $ 1,396