Walgreens 2011 Annual Report Download - page 21
Download and view the complete annual report
Please find page 21 of the 2011 Walgreens annual report below. You can navigate through the pages in the report by either clicking on the pages listed below, or by using the keyword search tool below to find specific information within the annual report.-
 1
1 -
2
-
3
-
4
-
5
-
6
-
7
-
8
-
9
-
10
-
 11
11 -
 12
12 -
 13
13 -
 14
14 -
 15
15 -
 16
16 -
 17
17 -
 18
18 -
 19
19 -
 20
20 -
 21
21 -
 22
22 -
 23
23 -
 24
24 -
 25
25 -
 26
26 -
 27
27 -
 28
28 -
 29
29 -
 30
30 -
 31
31 -
32
-
33
-
34
-
35
-
36
-
37
-
38
-
39
-
40
-
41
-
42
-
43
-
44
 |
 |

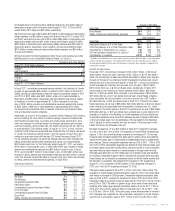
Percent to Net Sales
Fiscal Year 2011 2010 2009
Gross Margin 28.4 28.1 27.8
Selling, General and Administrative Expenses 23.0 23.0 22.7
Other Statistics
Fiscal Year 2011 2010 2009
Prescription Sales as a % of Net Sales 64.7 65.2 65.3
Third Party Sales as a % of Total Prescription Sales 95.6 95.3 95.4
Total Number of Prescriptions (In millions) 718 695 651
30-Day Equivalent Prescriptions (In millions)* 819 778 723
Total Number of Locations 8,210 8,046 7,496
* Includes the adjustment to convert prescriptions greater than 84 days to the equivalent
of three 30-day prescriptions. This adjustment reflects the fact that these prescriptions
include approximately three times the amount of product days supplied compared to a
normal prescription.
Results of Operations
Fiscal year 2011 net earnings increased 29.8% to $2.7 billion, or $2.94 per
diluted share, versus last year’s earnings of $2.1 billion, or $2.12 per diluted
share. The net earnings increase was primarily attributable to higher gross margins,
the gain on the sale of our pharmacy benefit management business and a lower
effective tax rate. During the fourth quarter of fiscal 2011, we sold our pharmacy
benefit management business and recorded a pre-tax gain of $434 million,
$273 million after tax, or $.30 per diluted share. Additionally, in fiscal 2011,
we recorded pre-tax Rewiring for Growth expenses of $45 million, $28 million
after tax, or $.03 per diluted share compared to pre-tax expenses of $106 million,
$67 million after tax, or $.07 per diluted share last year. Duane Reade, including
costs associated with the acquisition, recorded a pre-tax loss of $11 million,
$7 million after tax, or $.01 per diluted share in fiscal 2011. In fiscal 2010, Duane
Reade recorded a pre-tax loss of $88 million, $56 million after tax, or $.06 per diluted
share, including costs associated with the acquisition. Drugstore.com, inc., which
was acquired in the fourth quarter of fiscal 2011, reported a pre-tax loss of $29 million,
$18 million after tax, or $.02 per diluted share, primarily due to costs related to the
acquisition. In addition to the Rewiring for Growth expenses and Duane Reade loss
on operations described above, fiscal 2010 earnings included a charge of $43 million,
or $.04 per diluted share, from the elimination of the tax benefit for the Medicare
Part D subsidy for retiree benefits that was the result of the enactment of the
Patient Protection and Affordable Care Act.
Net sales increased by 7.1% to $72.2 billion in fiscal 2011 compared to increases
of 6.4% in 2010 and 7.3% in 2009. The acquisition of Duane Reade increased total
sales by 1.7% in the current fiscal year compared to an increase of 1.1% last year.
Drugstore sales increases resulted from sales gains in existing stores and additional
sales from new stores, each of which include an indeterminate amount of market-driven
price changes. Sales in comparable drugstores were up 3.3% in 2011, 1.6% in 2010
and 2.0% in 2009. Comparable drugstores are defined as those that have been open
for at least twelve consecutive months without closure for seven or more consecutive
days and without a major remodel or a natural disaster in the past twelve months.
Remodels associated with our CCR initiative are not considered major and therefore
do not affect comparable drugstore results. Relocated and acquired stores (including
Duane Reade) are not included as comparable stores for the first twelve months after
the relocation or acquisition. We operated 8,210 locations (7,761 drugstores) at
August 31, 2011, compared to 8,046 locations (7,562 drugstores) at August 31,
2010, and 7,496 (6,997 drugstores) at August 31, 2009.
Prescription sales increased 6.3% in 2011, 6.3% in 2010 and 7.8% in 2009. The
acquisition of Duane Reade increased prescription sales by 1.2% in the current fiscal
year versus an increase of 0.8% last year. Comparable drugstore prescription sales
were up 3.3% in 2011 compared to increases of 2.3% in 2010 and 3.5% in 2009.
Prescription sales as a percent of total net sales were 64.7% in 2011, 65.2% in 2010
and 65.3% in 2009. The effect of generic drugs, which have a lower retail price,
replacing brand name drugs reduced prescription sales by 2.4% for 2011, 2.2% for
2010 and 3.0% for 2009, while the effect on total sales was 1.4% for 2011, 1.3%
for 2010 and 1.9% for 2009. Third party sales, where reimbursement is received
from managed care organizations, the government, employers or private insurers,
were 95.6% of prescription sales in 2011, 95.3% in 2010 and 95.4% in 2009.
incremental amount of inventory below traditional retail prices. The dilutive effect of
these sales on gross profit for the years ended August 31, 2011, 2010 and 2009
was $3 million, $21 million and $32 million, respectively.
We incurred pre-tax costs of $45 million ($42 million of restructuring and restructuring-
related expenses, and $3 million of gross profit dilution) in fiscal 2011. In fiscal 2010
and 2009, we incurred pre-tax costs of $106 million ($85 million of restructuring and
restructuring-related costs and $21 million of gross profit dilution) and $252 million
($220 million of restructuring and restructuring-related expenses and $32 million of
gross profit dilution), respectively. Since inception, we have incurred $403 million
($347 million of restructuring and restructuring-related expenses, and $56 million
of gross profit dilution).
We have recorded the following balances within the accrued expenses and other
liabilities section of our Consolidated Balance Sheets (In millions):
Severance and Other Benefits
August 31, 2009 Reserve Balance $ 4
Charges 19
Cash Payments (23)
August 31, 2010 Reserve Balance $ —
Charges 5
Cash Payments (5)
August 31, 2011 Reserve Balance $ —
In fiscal 2011, we realized incremental savings related to the Rewiring for Growth
program of approximately $354 million compared to $471 million in fiscal 2010.
Selling, general and administrative expenses realized incremental savings in 2011
and 2010 of $312 million and $391 million, while cost of sales benefited by
$42 million and $80 million, respectively. We have realized total savings related
to Rewiring for Growth of approximately $1.1 billion compared to our base
year of 2008. Selling, general and administrative expenses realized total savings
of $953 million, while cost of sales benefited by approximately $122 million.
The savings are primarily the result of reduced store labor and personnel reduc-
tions and expense reduction initiatives.
Additionally, as a part of the Company’s Customer Centric Retailing (CCR) initiative,
we are modifying the store format to enhance category layouts and adjacencies,
shelf heights and sight lines, and brand and private brand assortments, all of
which are designed to positively impact the shopper experience and increase
customer frequency and purchase size. We expect this format will be rolled out
to approximately 5,500 existing stores. At August 31, 2011, in total, we have
converted 5,078 stores and opened 509 new stores with the CCR format. We expect
to convert the remaining existing stores in the first quarter of fiscal 2012 and
continue to open new stores with the new CCR format throughout fiscal 2012.
For the remaining remodels, we expect the average total cost, which includes both
selling, general and administrative expenses and capital, to be approximately
$45 thousand per store. For the fiscal year ended August 31, 2011, we incurred
$144 million in total program costs, of which $84 million was included in selling,
general and administrative expenses and $60 million in capital costs. In fiscal
2010, we incurred $71 million in total program costs, of which $45 million was
included in selling, general and administrative expenses and $26 million in capital
costs. The Company incurred $5 million in program costs, all of which was included
in selling, general and administrative expenses, in fiscal 2009.
Operating Statistics
Percentage Increases/
(Decreases)
Fiscal Year 2011 2010 2009
Net Sales 7.1 6.4 7.3
Net Earnings 29.8 4.2 (7.0)
Comparable Drugstore Sales 3.3 1.6 2.0
Prescription Sales 6.3 6.3 7.8
Comparable Drugstore Prescription Sales 3.3 2.3 3.5
Front-End Sales 8.5 6.8 6.3
Comparable Drugstore Front-End Sales 3.3 0.5 (0.5)
Gross Profit 8.0 7.7 5.8
Selling, General and Administrative Expenses 6.7 8.0 8.8
2011 Walgreens Annual Report Page 19