Walgreens 2011 Annual Report Download - page 35
Download and view the complete annual report
Please find page 35 of the 2011 Walgreens annual report below. You can navigate through the pages in the report by either clicking on the pages listed below, or by using the keyword search tool below to find specific information within the annual report.-
 1
1 -
2
-
3
-
4
-
5
-
6
-
7
-
8
-
9
-
10
-
11
-
12
-
13
-
14
-
15
-
16
-
17
-
18
-
19
-
20
-
21
-
22
-
23
-
24
-
 25
25 -
 26
26 -
 27
27 -
 28
28 -
 29
29 -
 30
30 -
 31
31 -
 32
32 -
 33
33 -
 34
34 -
 35
35 -
 36
36 -
 37
37 -
 38
38 -
 39
39 -
 40
40 -
 41
41 -
 42
42 -
 43
43 -
 44
44
 |
 |

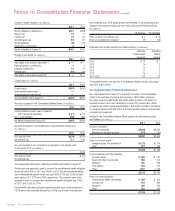
The carrying amount and accumulated amortization of intangible assets consists
of the following (In millions):
2011 2010
Gross Intangible Assets
Purchased prescription files $ 913 $ 749
Favorable lease interests 385 377
Purchasing and payer contracts 308 280
Non-compete agreements 95 69
Trade name 71 44
Other amortizable intangible assets 4 34
Total gross intangible assets 1,776 1,553
Accumulated amortization
Purchased prescription files (338) (293)
Favorable lease interests (76) (38)
Purchasing and payer contracts (94) (68)
Non-compete agreements (43) (33)
Trade name (11) (3)
Other amortizable intangibles (2) (4)
Total accumulated amortization (564) (439)
Total intangible assets, net $ 1,212 $ 1,114
Amortization expense for intangible assets was $219 million in fiscal 2011, $182 million
in fiscal 2010 and $148 million in fiscal 2009. The weighted-average amortization
period for purchased prescription files was seven years for fiscal 2011 and six years
fiscal 2010. The weighted-average amortization period for favorable lease interests
was 11 years for fiscal 2011 and 2010. The weighted-average amortization period
for purchasing and payer contracts was 13 years for fiscal 2011 and 2010. The
weighted-average amortization period for non-compete agreements was five years
for fiscal 2011 and 2010. The weighted-average amortization period for trade names
was nine years for fiscal 2011 and five years for fiscal 2010. Trade names include
$6 million of indefinite life assets. The weighted-average amortization period for
other intangible assets was 10 years for fiscal 2011 and 2010.
Expected amortization expense for intangible assets recorded at August 31, 2011,
is as follows (In millions):
2012 2013 2014 2015 2016
$218 $192 $160 $128 $90
6. Income Taxes
The provision for income taxes consists of the following (In millions):
2011 2010 2009
Current provision –
Federal $ 1,301 $ 1,129 $ 807
State 147 90 91
1,448 1,219 898
Deferred provision –
Federal 113 62 243
State 19 1 17
132 63 260
Income tax provision $ 1,580 $ 1,282 $ 1,158
The difference between the statutory federal income tax rate and the effective tax
rate is as follows:
2011 2010 2009
Federal statutory rate 35.0 % 35.0 % 35.0 %
State income taxes, net of federal benefit 2.6 2.2 2.2
Medicare Part D Subsidy — 1.3 —
Other (0.8) (0.5) (0.6)
Effective income tax rate 36.8 % 38.0% 36.6%
The deferred tax assets and liabilities included in the Consolidated Balance Sheets
consist of the following (In millions):
2011 2010
Deferred tax assets –
Postretirement benefits $ 214 $ 179
Compensation and benefits 165 228
Insurance 226 190
Accrued rent 112 176
Tax benefits 327 138
Stock compensation 179 133
Inventory 143 59
Other 78 123
Subtotal 1,444 1,226
Less: Valuation allowance 91 —
Total deferred tax assets 1,353 1,226
Deferred tax liabilities –
Accelerated depreciation 1,176 1,050
Inventory 476 356
Intangible assets 49 117
Other 31 45
Subtotal 1,732 1,568
Net deferred tax liabilities $ 379 $ 342
At August 31, 2011, the Company has recorded deferred tax assets of $287 million
reflecting the benefit of $452 million in federal and $940 million in state loss
carryforwards. These deferred tax assets will expire at various dates from 2012
through 2031.
The Company believes it is more likely than not that the benefit from certain net
operating loss carryforwards will not be realized. In recognition of this risk, the
Company has recorded a valuation allowance of $91 million on certain deferred
tax assets relating to these net operating losses.
Income taxes paid were $1,320 million, $1,195 million and $768 million during
the fiscal years ended August 31, 2011, 2010 and 2009, respectively.
ASC Topic 740, Income Taxes, provides guidance regarding the recognition,
measurement, presentation and disclosure in the financial statements of tax
positions taken or expected to be taken on a tax return, including the decision
whether to file in a particular jurisdiction. All unrecognized benefits at August 31,
2011, and August 31, 2010, were classified as long-term liabilities on the
Consolidated Balance Sheets.
The following table provides a reconciliation of the total amounts of unrecognized tax
benefits for fiscal 2011 (In millions):
2011 2010 2009
Balance at beginning of year $ 93 $ 128 $ 64
Gross increases related to tax positions
in a prior period 25 12 38
Gross decreases related to tax positions
in a prior period (68) (57) (5)
Gross increases related to tax positions
in the current period 54 37 38
Settlements with taxing authorities (8) (21) (1)
Lapse of statute of limitations (2) (6) (6)
Balance at end of year $ 94 $ 93 $ 128
At August 31, 2011, 2010 and 2009, $81 million, $57 million and $43 million,
respectively, of unrecognized tax benefits would favorably impact the effective
tax rate if recognized.
2011 Walgreens Annual Report Page 33