Walgreens 2011 Annual Report Download - page 39
Download and view the complete annual report
Please find page 39 of the 2011 Walgreens annual report below. You can navigate through the pages in the report by either clicking on the pages listed below, or by using the keyword search tool below to find specific information within the annual report.-
 1
1 -
2
-
3
-
4
-
5
-
6
-
7
-
8
-
9
-
10
-
11
-
12
-
13
-
14
-
15
-
16
-
17
-
18
-
19
-
20
-
21
-
22
-
23
-
24
-
25
-
26
-
27
-
28
-
 29
29 -
 30
30 -
 31
31 -
 32
32 -
 33
33 -
 34
34 -
 35
35 -
 36
36 -
 37
37 -
 38
38 -
 39
39 -
 40
40 -
 41
41 -
 42
42 -
 43
43 -
 44
44
 |
 |

The Walgreen Co. Nonemployee Director Stock Plan provides that each nonemployee
director receives an equity grant of shares each year on November 1. Effective
November 1, 2009, the value of the annual stock grant made to directors on each
November 1 increased from $120,000 to $155,000. The number of shares granted
is determined by dividing $155,000 by the price of a share of common stock on
November 1. Each nonemployee director may elect to receive this annual share grant
in the form of shares or deferred stock units. Each nonemployee director received a
grant of 4,552 shares in fiscal 2011, 4,097 shares in fiscal 2010 and 4,713 shares
in fiscal 2009. New directors in any of the fiscal years were given a prorated amount.
Effective November 1, 2009, the payment of the annual retainer was changed to
be paid only in the form of cash, which may still be deferred. Previously, the annual
retainer was paid one-half in cash and one-half in Walgreen Co. common stock.
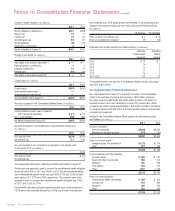
A summary of information relative to the Company’s stock option plans follows:
Weighted-
Weighted- Average Aggregate
Average Remaining Intrinsic
Exercise Contractual Value
Options Shares Price Term (Years) (In millions)
Outstanding
at August 31, 2010 49,107,203 34.75 6.03 $ 16
Granted 9,015,933 28.93
Exercised (4,349,340) 33.74
Expired/Forfeited (4,739,950) 35.44
Outstanding
at August 31, 2011 49,033,846 33.70 6.04 193
Vested or expected to vest
at August 31, 2011 28,919,936 29.89 7.75 164
Exercisable
at August 31, 2011 19,154,555 39.63 3.32 $ 24
The intrinsic value for options exercised in fiscal 2011, 2010 and 2009 was $33 million,
$29 million and $6 million, respectively. The total fair value of options vested in fiscal
2011, 2010 and 2009 was $58 million, $53 million and $56 million, respectively.
Cash received from the exercise of options in fiscal 2011 was $147 million compared
to $134 million in the prior year. The related tax benefit realized was $14 million in
fiscal 2011 compared to $11 million in the prior year.
A summary of information relative to the Company’s restricted stock awards follows:
Weighted-Average
Nonvested Shares Shares Grant-Date Fair Value
Nonvested at August 31, 2010 96,710 $ 37.53
Granted — —
Forfeited (111) 36.43
Vested (48,553) 38.92
Nonvested at August 31, 2011 48,046 $ 36.13
A summary of information relative to the Company’s restricted stock unit plan follows:
Weighted-Average
Outstanding Shares Shares Grant-Date Fair Value
Outstanding at August 31, 2010 1,148,164 $ 34.40
Granted 1,005,255 33.13
Dividends 37,510 38.16
Forfeited (191,137) 33.31
Vested (88,555) 32.76
Outstanding at August 31, 2011 1,911,237 $ 33.94
A summary of information relative to the Company’s performance share plan follows:
Weighted-Average
Outstanding Shares Shares Grant-Date Fair Value
Outstanding at August 31, 2010 996,621 $ 35.02
Granted 840,101 28.30
Forfeited (17,054) 29.21
Vested — —
Outstanding at August 31, 2011 1,819,668 $ 31.83
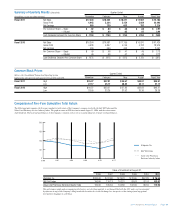
The fair value of each option grant was determined using the Black-Scholes option
pricing model with weighted-average assumptions used in fiscal 2011, 2010
and 2009:
2011 2010 2009
Risk-free interest rate (1) 2.12% 3.14% 3.47%
Average life of option (years) (2) 7.2 7.3 6.8
Volatility (3) 28.08% 28.01% 34.00%
Dividend yield (4) 1.94% 1.91% 2.30%
Weighted-average grant-date fair value
Granted at market price $ 8.12 $ 9.80 $ 9.14
(1) Represents the U.S. Treasury security rates for the expected term of the option.
(2) Represents the period of time that options granted are expected to be outstanding.
The Company analyzed separate groups of employees with similar exercise behavior
to determine the expected term.
(3) Volatility was based on historical and implied volatility of the Company’s common stock.
(4) Represents the Company’s cash dividend for the expected term.
13. Retirement Benefits
The principal retirement plan for employees is the Walgreen Profit-Sharing Retirement
Trust, to which both the Company and participating employees contribute.
The Company’s contribution, which has historically related to pre-tax income and a
portion of which is in the form of a guaranteed match, is determined annually at the
discretion of the Board of Directors. The profit-sharing provision was $382 million
in fiscal 2011, $300 million in fiscal 2010 and $282 million in fiscal 2009. The
Company’s contributions were $322 million in fiscal 2011, $293 million in fiscal
2010 and $301 million in fiscal 2009.
The Company provides certain health insurance benefits for retired employees who meet
eligibility requirements, including age, years of service and date of hire. The costs of
these benefits are accrued over the service life of the employee. The postretirement
health benefit plans are not funded. In May 2009, the postretirement health benefit plans
were amended to change eligibility requirements. As a result of this amendment, the
Company recognized curtailment income of $16 million in fiscal 2009. Additionally in
fiscal 2009, the Company recognized a special retirement benefit expense of $4 million
related to accelerating eligibility for certain employees who elected special early
retirement as a part of its Rewiring for Growth program.
Components of net periodic benefit costs (In millions):
2011 2010 2009
Service cost $ 15 $ 11 $ 12
Interest cost 22 20 26
Amortization of actuarial loss 14 7 4
Amortization of prior service cost (10) (10) (6)
Special retirement benefit — — 4
Curtailment gain — — (16)
Total postretirement benefit cost $ 41 $ 28 $ 24
2011 Walgreens Annual Report Page 37