Walgreens 2011 Annual Report Download - page 22
Download and view the complete annual report
Please find page 22 of the 2011 Walgreens annual report below. You can navigate through the pages in the report by either clicking on the pages listed below, or by using the keyword search tool below to find specific information within the annual report.-
 1
1 -
2
-
3
-
4
-
5
-
6
-
7
-
8
-
9
-
10
-
11
-
 12
12 -
 13
13 -
 14
14 -
 15
15 -
 16
16 -
 17
17 -
 18
18 -
 19
19 -
 20
20 -
 21
21 -
 22
22 -
 23
23 -
 24
24 -
 25
25 -
 26
26 -
 27
27 -
 28
28 -
 29
29 -
 30
30 -
 31
31 -
 32
32 -
33
-
34
-
35
-
36
-
37
-
38
-
39
-
40
-
41
-
42
-
43
-
44
 |
 |
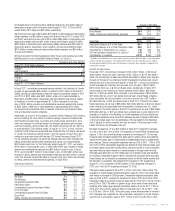
We receive market-driven reimbursements from third party payers, a number of
which typically reset in January. The total number of prescriptions filled (including
immunizations) was approximately 718 million in 2011, 695 million in 2010 and
651 million in 2009. Prescriptions adjusted to 30-day equivalents were 819 million
in 2011, 778 million in 2010 and 723 million in 2009.
Front-end sales increased 8.5% in 2011, 6.8% in 2010 and 6.3% in 2009.
The acquisition of Duane Reade increased front-end sales by 2.8% in the current
year versus an increase of 1.9% last year. Additionally, the increase over the
prior year is due, in part, to new store openings and improved sales related to
non-prescription drugs, convenience and fresh foods and personal care products.
Front-end sales were 35.3% of total sales in fiscal 2011, 34.8% of total sales in
fiscal 2010 and 34.7% in fiscal 2009. Comparable drugstore front-end sales increased
3.3% in 2011 compared to an increase of 0.5% and decrease of 0.5% in fiscal years
2010 and 2009, respectively. The increase in fiscal 2011 comparable front-end sales
was primarily due to non-prescription drugs, beer and wine and convenience and fresh
foods, which were partially offset by decreased sales in household products.
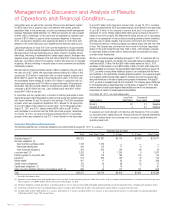
Gross margin as a percent of sales increased to 28.4% in 2011 from 28.1% in 2010.
Overall margins were positively impacted by higher front-end margins in the non-
prescription drug, beauty, personal care and convenience and fresh food categories.
Retail pharmacy margins were also higher as the positive effect of generic drug sales
more than offset market-driven reimbursements and the first quarter write-down of
flu shot inventory. These positive effects were partially offset by a higher provision for
LIFO. Gross margin as a percent of sales was 28.1% in 2010 as compared to 27.8%
in 2009. Overall margins were positively impacted by higher front-end margins due
to pricing, promotion and other improved efficiencies and lower Rewiring for Growth
costs. Retail pharmacy margins benefited from the positive impact of generic drug
introductions but were partially offset by market-driven reimbursement rates.
We use the last-in, first-out (LIFO) method of inventory valuation. The LIFO provision
is dependent upon inventory levels, inflation rates and merchandise mix. The effective
LIFO inflation rates were 2.39% in 2011, 1.70% in 2010, and 2.00% in 2009,
which resulted in charges to cost of sales of $208 million in 2011, $140 million
in 2010 and $172 million in 2009. Inflation on prescription inventory was 4.64%
in 2011, 4.72% in 2010 and 2.40% in 2009. In fiscal years 2010 and 2009,
we experienced deflation in some non-prescription inventories. The anticipated
LIFO inflation rate for fiscal 2012 is 2.00%.
Selling, general and administrative expenses were 23.0% of sales in fiscal 2011 and
2010, and 22.7% in fiscal 2009. In the current fiscal year, increased corporate costs
and Duane Reade operational expenses were offset by lower Rewiring for Growth
costs and incremental savings from our Rewiring for Growth activities, primarily from
expense reduction initiatives and reduced store payroll, as a percentage of sales. The
increase in fiscal 2010 as compared to fiscal 2009 was attributed to higher occupancy
expense, Duane Reade operational expenses and costs associated with the Duane
Reade acquisition. These expenses were partially offset by lower Rewiring for Growth
costs and advertising expense. Also positively impacting fiscal 2010 selling, general
and administrative expenses was incremental savings from our Rewiring for Growth
activities, primarily from expense reduction initiatives and reduced store payroll.
Interest was a net expense of $71 million in fiscal 2011, $85 million in fiscal 2010
and $83 million in fiscal 2009. Interest expense for fiscal 2011, 2010 and 2009 is
net of $10 million, $12 million and $16 million, respectively, that was capitalized
to construction projects. The decrease in net interest expense from fiscal 2010 to
fiscal 2011 is primarily attributed to reduced interest rates associated with our fixed
to variable interest rate swaps.
The effective income tax rate was 36.8% for fiscal 2011, 38.0% for 2010, and 36.6%
for 2009. Fiscal 2010 included a $43 million charge to deferred taxes for the repeal
of the tax benefit for the Medicare Part D subsidy for retiree benefits. Excluding this
adjustment, the effective rate for fiscal 2010 was 36.7%. We anticipate an
effective tax rate of approximately 37.3% in fiscal 2012.
Critical Accounting Policies
The consolidated financial statements are prepared in accordance with accounting
principles generally accepted in the United States of America and include amounts
based on management’s prudent judgments and estimates. Actual results may differ
from these estimates. Management believes that any reasonable deviation from
Management’s Discussion and Analysis of Results
of Operations and Financial Condition (continued)
those judgments and estimates would not have a material impact on our consolidated
financial position or results of operations. To the extent that the estimates used
differ from actual results, however, adjustments to the statement of earnings and
corresponding balance sheet accounts would be necessary. These adjustments
would be made in future statements. Some of the more significant estimates
include goodwill and other intangible asset impairment, allowance for doubtful
accounts, vendor allowances, asset impairments, liability for closed locations,
liability for insurance claims, cost of sales and income taxes. We use the following
methods to determine our estimates:
Goodwill and other intangible asset impairment – Goodwill and other indefinite-lived
intangible assets are not amortized, but are evaluated for impairment annually
during the fourth quarter, or more frequently if an event occurs or circumstances
change that would more likely than not reduce the fair value of a reporting unit
below its carrying value. As part of our impairment analysis for each reporting unit,
we engage a third party appraisal firm to assist in the determination of estimated
fair value for each unit. This determination includes estimating the fair value using
both the income and market approaches. The income approach requires manage-
ment to estimate a number of factors for each reporting unit, including projected
future operating results, economic projections, anticipated future cash flows and
discount rates. The market approach estimates fair value using comparable
marketplace fair value data from within a comparable industry grouping.
The determination of the fair value of the reporting units and the allocation of that
value to individual assets and liabilities within those reporting units requires us to
make significant estimates and assumptions. These estimates and assumptions
primarily include, but are not limited to: the selection of appropriate peer group
companies; control premiums appropriate for acquisitions in the industries in which
we compete; the discount rate; terminal growth rates; and forecasts of revenue,
operating income, depreciation and amortization and capital expenditures. The
allocation requires several analyses to determine fair value of assets and liabilities
including, among other things, purchased prescription files, customer relationships
and trade names. Although we believe our estimates of fair value are reasonable,
actual financial results could differ from those estimates due to the inherent uncer-
tainty involved in making such estimates. Changes in assumptions concerning
future financial results or other underlying assumptions could have a significant
impact on either the fair value of the reporting units, the amount of the goodwill
impairment charge, or both.
We also compared the sum of the estimated fair values of the reporting units to
the Company’s total value as implied by the market value of the Company’s equity
and debt securities. This comparison indicated that, in total, our assumptions and
estimates were reasonable. However, future declines in the overall market value
of the Company’s equity and debt securities may indicate that the fair value of
one or more reporting units has declined below its carrying value.
One measure of the sensitivity of the amount of goodwill impairment charges to
key assumptions is the amount by which each reporting unit “passed” (fair value
exceeds the carrying amount) or “failed” (the carrying amount exceeds fair value)
the first step of the goodwill impairment test. Our reporting units’ fair values exceeded
their carrying amounts by 5% to more than 300%. The fair values for two reporting
units each exceeded their carrying amounts by 10% or less. Goodwill allocated to
these reporting units was $173 million at May 31, 2011. For each of these reporting
units, relatively small changes in the Company’s key assumptions may have resulted
in the recognition of significant goodwill impairment charges. Our Long Term Care
Pharmacy’s goodwill was impaired by $16 million in fiscal 2010 as a result of the
asset sale agreement with Omnicare, Inc., which was signed on August 31, 2010.
Generally, changes in estimates of expected future cash flows would have a similar
effect on the estimated fair value of the reporting unit. That is, a 1% change in
estimated future cash flows would decrease the estimated fair value of the reporting
unit by approximately 1%. The estimated long-term rate of net sales growth can
have a significant impact on the estimated future cash flows, and therefore, the
fair value of each reporting unit. For the two reporting units whose fair values
exceeded carrying values by 10% or less, a 1% decrease in the long-term net
sales growth rate would have resulted in the reporting units failing the first step
of the goodwill impairment test. Of the other key assumptions that impact the
estimated fair values, most reporting units have the greatest sensitivity to changes
Page 20 2011 Walgreens Annual Report