Walgreens 2011 Annual Report Download - page 3
Download and view the complete annual report
Please find page 3 of the 2011 Walgreens annual report below. You can navigate through the pages in the report by either clicking on the pages listed below, or by using the keyword search tool below to find specific information within the annual report.-
 1
1 -
 2
2 -
 3
3 -
 4
4 -
 5
5 -
 6
6 -
 7
7 -
 8
8 -
 9
9 -
 10
10 -
 11
11 -
 12
12 -
 13
13 -
 14
14 -
15
-
16
-
17
-
18
-
19
-
20
-
21
-
22
-
23
-
24
-
25
-
26
-
27
-
28
-
29
-
30
-
31
-
32
-
33
-
34
-
35
-
36
-
37
-
38
-
39
-
40
-
41
-
42
-
43
-
44
 |
 |

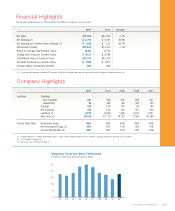
2011 2010 Increase
Net Sales $72,184 $ 67,420 7.1%
Net Earnings (1) $ 2,714 $ 2,091 29.8%
Net Earnings per Common Share (diluted) (1) $ 2.94 $ 2.12 38.7%
Shareholders’ Equity $14,847 $ 14,400 3.1%
Return on Average Shareholders’ Equity 18.6% 14.5%
Closing Stock Price per Common Share $ 35.21 $ 26.88
Total Market Value of Common Stock $ 31,312 $ 25,230
Dividends Declared per Common Share $ .7500 $ .5875
Average Shares Outstanding (diluted) 924 988
(1) Fiscal year 2011 amounts include a $273 million, or $0.30 per diluted share, after-tax gain on the sale of Walgreens Health Initiatives, Inc.
Financial Highlights
For the years ended August 31, 2011 and 2010 (In millions, except per share amounts)
2011 2010 2009 2008 2007
Locations Openings
New Locations 261 388 602 608 501
Acquisitions 36 282 89 423 120
Closings 133 120 129 94 85
Net Openings 164 550 562 937 536
Locations (1) 8,210 8,046 7,496 6,934 5,997
Sales Area (2) 85,619 83,719 78,782 72,585 66,386
Product Class Sales Prescription Drugs 65% 65% 65% 65% 65%
Non-prescription Drugs (3) 10% 10% 10% 10% 10%
General Merchandise (3) 25% 25% 25% 25% 25%
(1) Includes drugstores, worksite health and wellness centers, infusion and respiratory services facilities, specialty pharmacies and mail service facilities.
(2) In thousands of square feet.
(3) Based on store scanning information.
Company Highlights
2011 Walgreens Annual Report Page 1
11100908070605040302
50
40
30
20
10
0
Walgreens Fiscal Year Stock Performance
Fiscal year-end closing price per share in dollars