Walgreens 2012 Annual Report Download - page 22
Download and view the complete annual report
Please find page 22 of the 2012 Walgreens annual report below. You can navigate through the pages in the report by either clicking on the pages listed below, or by using the keyword search tool below to find specific information within the annual report.-
 1
1 -
2
-
3
-
4
-
5
-
6
-
7
-
8
-
9
-
10
-
11
-
 12
12 -
 13
13 -
 14
14 -
 15
15 -
 16
16 -
 17
17 -
 18
18 -
 19
19 -
 20
20 -
 21
21 -
 22
22 -
 23
23 -
 24
24 -
 25
25 -
 26
26 -
 27
27 -
 28
28 -
 29
29 -
 30
30 -
 31
31 -
 32
32 -
33
-
34
-
35
-
36
-
37
-
38
-
39
-
40
-
41
-
42
-
43
-
44
-
45
-
46
-
47
-
48
 |
 |
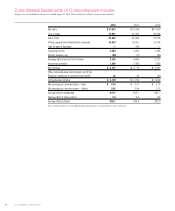
Results of Operations
Fiscal 2012 net earnings decreased 21.6% to $2.1 billion, or $2.42 per diluted
share, versus last year’s earnings of $2.7 billion, or $2.94 per diluted share. The
decrease was primarily attributable to lower sales, the sale of our pharmacy benefit
management business in fiscal 2011 and higher selling, general and administrative
expenses as a percentage of sales. Included in fiscal 2012 net earnings and net
earnings per diluted share, respectively, was $195 million, or $.22 per diluted share,
from the year’s LIFO provision and $161 million, or $.18 per diluted share, in
acquisition-related amortization. Fiscal 2012 net earnings and net earnings per
diluted share, respectively, also included $82 million, or $.11 per diluted share, of
transaction costs and interest, some of which are non-deductible for tax purposes,
and share issuance impact (which affected net earnings per diluted share only)
related to the Alliance Boots transaction. Included in fiscal 2011 net earnings and
net earnings per diluted share, respectively, were $273 million, or $.30 per diluted
share, associated with the gain on the sale of Walgreens Health Initiatives, Inc.,
$138 million, or $.15 per diluted share, in acquisition-related amortization and
$131 million, or $.14 per diluted share, from the year’s LIFO provision.
Net sales decreased by 0.8% to $71.6 billion in fiscal 2012 compared to increases
of 7.1% in 2011 and 6.4% in 2010. The acquisitions of BioScrip assets and
drugstore.com increased total sales by 1.0% in fiscal 2012. Net sales in fiscal 2012
were negatively impacted by our strategic decision to no longer be a part of the
Express Scripts pharmacy provider network, partially offset by sales gains in existing
stores and added sales from new stores, each of which included an indeterminate
amount of market-driven price changes. Sales in comparable drugstores were down
3.6% in 2012 and up 3.3% and 1.6% in fiscal years 2011 and 2010, respectively.
Comparable drugstores are defined as those that have been open for at least twelve
consecutive months without closure for seven or more consecutive days and without
a major remodel or a natural disaster in the past twelve months. Remodels associated
with our CCR initiative are not considered major and therefore do not affect comparable
drugstore results. Relocated and acquired stores are not included as comparable
stores for the first twelve months after the relocation or acquisition. We operated
8,385 locations (7,930 drugstores) at August 31, 2012, compared to 8,210 locations
(7,761 drugstores) at August 31, 2011, and 8,046 locations (7,562 drugstores)
at August 31, 2010.
Prescription sales decreased 3.1% in 2012 compared to increases of 6.3% in 2011
and 6.3% in 2010. Comparable drugstore prescription sales were down 6.1% in
2012 compared to increases of 3.3% in 2011 and 2.3% in 2010. Prescription sales
were negatively impacted by our strategic decision to no longer be part of the
Express Scripts pharmacy provider network. Prescription sales as a percent of total
net sales were 63.2% in 2012, 64.7% in 2011 and 65.2% in 2010. The effect of
generic drugs, which have a lower retail price, replacing brand name drugs reduced
prescription sales by 3.5% for 2012, 2.4% for 2011 and 2.2% for 2010, while the
effect on total sales was 1.9% for 2012, 1.4% for 2011 and 1.3% for 2010. Third
party sales, where reimbursement is received from managed care organizations, the
government, employers or private insurers, were 95.6% of prescription sales in 2012
and 2011 and 95.3% in 2010. We receive market-driven reimbursements from third
party payers, a number of which typically reset in January. The total number of pre-
scriptions filled (including immunizations) was approximately 664 million in 2012,
718 million in 2011 and 695 million in 2010. Prescriptions adjusted to 30-day
equivalents were 784 million in 2012, 819 million in 2011 and 778 million in 2010.
Front-end sales increased 3.6% in 2012, 8.5% in 2011 and 6.8% in 2010. The
increase over the prior year was due, in part, to new store openings and improved
sales related to non-prescription drugs, beer and wine, beauty, convenience and
fresh foods and photofinishing products. Front-end sales were 36.8% of total sales
in fiscal 2012, 35.3% of total sales in fiscal 2011 and 34.8% of total sales in
fiscal 2010. Comparable drugstore front-end sales increased 0.6% in 2012, 3.3% in
2011 and 0.5% in 2010. The increase in fiscal 2012 comparable front-end sales was
primarily due to the beer and wine, non-prescription drugs, beauty and photofinishing
categories, which were partially offset by decreased sales in household products.
Gross margin as a percent of sales was 28.4% in fiscal 2012 and 2011. Gross
margin in fiscal 2012 was positively impacted by higher front-end margins in the
household items, convenience and fresh foods and non-prescription drug categories
but offset by lower retail pharmacy margins where lower market-driven reimburse-
ments and a higher provision for LIFO more than offset the impact of new generics
including the generic Lipitor. Gross margin as a percent of sales was 28.4% in fiscal
2011 as compared to 28.1% in fiscal 2010. Overall margins were positively impacted
by higher front-end margins in the non-prescription drug, beauty, personal care
and convenience and fresh food categories. Retail pharmacy margins were also
higher as the positive effect of generic drug sales more than offset market-driven
reimbursements and the write-down of flu shot inventory. These positive effects
were partially offset by a higher provision for LIFO.
Gross profit dollars in fiscal 2012 decreased 0.7% over the prior year. The
decrease is primarily attributed to lower sales volumes and a higher provision for
LIFO. Gross profit dollars in fiscal 2011 increased 8.0% over fiscal 2010. The
increase is attributed to higher sales volumes and increased front-end and retail
pharmacy margins.
We use the last-in, first-out (LIFO) method of inventory valuation. The LIFO provision
is dependent upon inventory levels, inflation rates and merchandise mix. The effective
LIFO inflation rates were 3.30% in 2012, 2.39% in 2011, and 1.70% in 2010,
which resulted in charges to cost of sales of $309 million in 2012, $208 million
in 2011 and $140 million in 2010. Inflation on prescription inventory was 10.04%
in 2012, 4.64% in 2011 and 4.72% in 2010. As a result of declining inventory
levels, the fiscal 2012 LIFO provision was reduced by $268 million of LIFO liquidation.
In fiscal 2010, we experienced deflation in some non-prescription inventories.
The anticipated LIFO inflation rate for fiscal 2013 is 2.50%.
Selling, general and administrative expenses were 23.6% of sales in fiscal 2012
as compared to 23.0% in 2011. The increase was primarily due to higher occupancy
expense, drugstore.com expenses, including costs associated with the acquisition
and integration, investments in strategic initiatives and capabilities, expenses
associated with our investment in Alliance Boots GmbH and store direct expense,
which were partially offset by lower expenses associated with our CCR remodeling
program which was completed in the first quarter of fiscal 2012. Selling, general
and administrative expenses as a percentage of sales remained at 23.0% in
2011 as compared to fiscal 2010. Increased corporate costs and Duane Reade
operational expenses were offset by lower Rewiring for Growth costs and
incremental savings from our Rewiring for Growth activities, primarily from expense
reduction initiatives and reduced store payroll, as a percentage of sales.
Selling, general and administrative expense dollars increased $317 million, or 1.9%
over fiscal 2011. Operating and integration costs related to drugstore.com added
0.6% and costs associated with our investment in Alliance Boots GmbH added
0.4%. The remaining increase was primarily attributed to new stores. Selling,
general and administrative expense dollars in fiscal 2011 increased 6.7% over
fiscal 2010. The increase was attributed to higher comparable store spending,
new stores and the acquisition of Duane Reade.
Interest was a net expense of $88 million in fiscal 2012, $71 million in fiscal 2011
and $85 million in fiscal 2010. Interest expense for fiscal 2012, 2011 and 2010 is
net of $9 million, $10 million and $12 million, respectively, that was capitalized to
construction projects. In fiscal 2012, we incurred $21 million in interest expense on
the bridge term loan facility in conjunction with our investment in Alliance Boots GmbH.
This was partially offset by lower interest expense as a result of the additional
$500 million in fixed to variable interest rate swaps, $250 million of which
was entered into in May 2012 and $250 million of which was entered into in
March 2011. The reduction in net interest expense from fiscal 2010 to fiscal 2011
was attributed to reduced interest rates associated with our $1.3 billion of fixed
to variable interest rate swaps entered into in January 2010.
The effective income tax rate was 37.0% for fiscal 2012, 36.8% for 2011, and 38.0%
for 2010. The increase in the effective tax rate from fiscal 2011 was attributed to
certain non-deductible transaction costs associated with the investment in Alliance
Boots GmbH. Fiscal 2010 included a $43 million charge to deferred taxes for the
repeal of the tax benefit for the Medicare Part D subsidy for retiree benefits.
We anticipate an effective tax rate of approximately 37.0% in fiscal 2013 before
incorporating the investment in Alliance Boots GmbH.
Management’s Discussion and Analysis of Results of Operations
and Financial Condition (continued)
20 2012 Walgreens Annual Report