Walgreens 2012 Annual Report Download - page 43
Download and view the complete annual report
Please find page 43 of the 2012 Walgreens annual report below. You can navigate through the pages in the report by either clicking on the pages listed below, or by using the keyword search tool below to find specific information within the annual report.-
 1
1 -
2
-
3
-
4
-
5
-
6
-
7
-
8
-
9
-
10
-
11
-
12
-
13
-
14
-
15
-
16
-
17
-
18
-
19
-
20
-
21
-
22
-
23
-
24
-
25
-
26
-
27
-
28
-
29
-
30
-
31
-
32
-
 33
33 -
 34
34 -
 35
35 -
 36
36 -
 37
37 -
 38
38 -
 39
39 -
 40
40 -
 41
41 -
 42
42 -
 43
43 -
 44
44 -
 45
45 -
 46
46 -
 47
47 -
 48
48
 |
 |
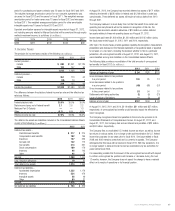
Summary of Quarterly Results (Unaudited) Quarter Ended
(In millions, except per share amounts) November February May August (1) Fiscal Year
Fiscal 2012 Net Sales $ 18,157 $ 18,651 $ 17,752 $ 17,073 $ 71,633
Gross Profit 5,104 5,389 5,014 4,835 20,342
Net Earnings 554 683 537 353 2,127
Per Common Share – Basic $ .63 $ .79 $ .63 $ .40 $ 2.43
– Diluted .63 .78 .62 .39 2.42
Cash Dividends Declared Per Common Share $ .225 $ .225 $ .225 $ .275 $ .950
Fiscal 2011 Net Sales $ 17,344 $ 18,502 $ 18,371 $ 17,967 $ 72,184
Gross Profit 4,945 5,324 5,154 5,069 20,492
Net Earnings 580 739 603 792 2,714
Per Common Share – Basic $ .62 $ .80 $ .66 $ .88 $ 2.97
– Diluted .62 .80 .65 .87 2.94
Cash Dividends Declared Per Common Share $ .175 $ .175 $ .175 $ .225 $ .750
(1) Results for the fiscal quarter ending August 31, 2011 include a pre-tax gain of $434 million and $273 million, or $.30 per diluted share, after tax,
from the sale of Walgreens Health Initiatives, Inc., a pharmacy benefit management business.
Common Stock Prices
Quarter Ended
Below is the Consolidated Transaction Reporting System
high and low sales price for each quarter of fiscal 2012 and 2011. November February May August Fiscal Year
Fiscal 2012 High $ 36.27 $ 34.60 $ 35.41 $ 36.08 $ 36.27
Low 30.10 31.95 30.28 28.77 28.77
Fiscal 2011 High $ 35.27 $ 42.91 $ 44.67 $ 44.91 $ 44.91
Low 27.17 35.17 38.82 34.11 27.17
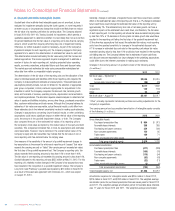
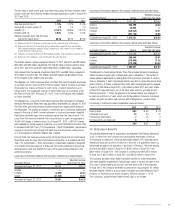
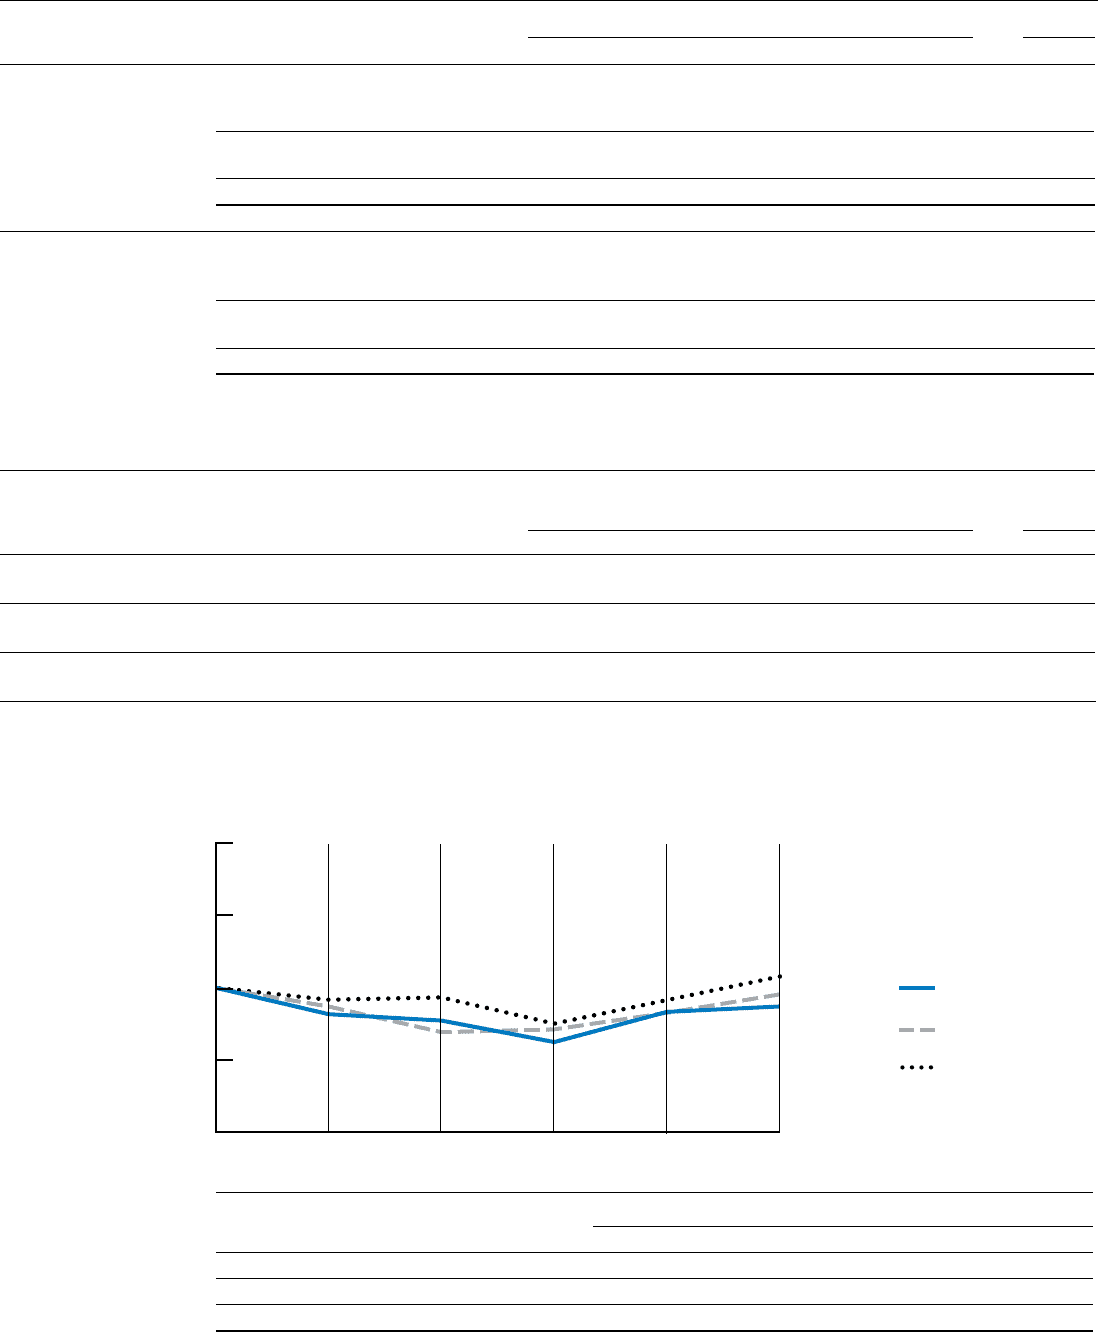
Comparison of Five-Year Cumulative Total Return
The following graph compares the five-year cumulative total return of the Company’s common stock with the S&P 500 Index and the
Value Line Pharmacy Services Industry Index. The graph assumes a $100 investment made August 31, 2007, and the reinvestment
of all dividends. The historical performance of the Company’s common stock is not necessarily indicative of future stock performance.
2007 2008 2009 2010 2011 2012
Walgreen Co. $100.00 $ 81.71 $ 77.29 $ 62.41 $ 83.34 $ 87.08
S&P 500 Index 100.00 87.03 69.24 71.19 82.69 95.43
Value Line Pharmacy Services Industry Index 100.00 91.74 93.34 75.17 91.51 107.84
This performance graph and accompanying disclosure is not soliciting material, is not deemed filed with the SEC, and is not incorporated
by reference in any of the Company’s filings under the Securities Act or the Exchange Act, irrespective of the timing of and any general
incorporation language in such filing.
Value of Investment at August 31,
8/08 8 / 09 8/10 8 / 11 8/ 1 2
8/07
0
50
100
150
200
S&P 500 Index
Value Line Pharmacy
Services Industry Index
Walgreen Co.
2012 Walgreens Annual Report 41