Walgreens 2012 Annual Report Download - page 46
Download and view the complete annual report
Please find page 46 of the 2012 Walgreens annual report below. You can navigate through the pages in the report by either clicking on the pages listed below, or by using the keyword search tool below to find specific information within the annual report.-
 1
1 -
2
-
3
-
4
-
5
-
6
-
7
-
8
-
9
-
10
-
11
-
12
-
13
-
14
-
15
-
16
-
17
-
18
-
19
-
20
-
21
-
22
-
23
-
24
-
25
-
26
-
27
-
28
-
29
-
30
-
31
-
32
-
33
-
34
-
35
-
 36
36 -
 37
37 -
 38
38 -
 39
39 -
 40
40 -
 41
41 -
 42
42 -
 43
43 -
 44
44 -
 45
45 -
 46
46 -
 47
47 -
 48
48
 |
 |

44 2012 Walgreens Annual Report
The information above provides reconciliations of the supplemental non-GAAP
financial measures, as defined under SEC rules, presented in this Annual Report
to the most directly comparable financial measures calculated and presented in
accordance with generally accepted accounting principles in the United States
(GAAP). The Company has provided these supplemental non-GAAP financial
measures in the Annual Report, which are not calculated or presented in accordance
with GAAP, as supplemental information and in addition to the financial measures
that are calculated and presented in accordance with GAAP. These supplemental
non-GAAP financial measures are presented because management has evaluated
the Company’s financial results both including and excluding the adjusted items
and believes that the supplemental non-GAAP financial measures presented
provide additional perspective and insights when analyzing the core operating
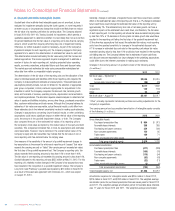
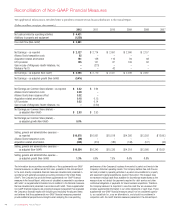
Reconciliation of Non-GAAP Financial Measures
The supplemental information in the tables below is provided to reconcile certain financial disclosures in this Annual Report.
(Dollars in millions, except per share amounts)
2012 2011 2010 2009 2008 2007
Net cash provided by operating activities $ 4,431
Additions to property and equipment (1,550)
Free cash flow (Non-GAAP) $ 2,881
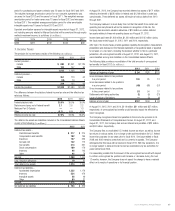
Net Earnings – as reported $ 2,127 $ 2,714 $ 2,091 $ 2,006 $ 2,157
Alliance Boots transaction costs 82 – – – –
Acquisition-related amortization 161 138 116 94 68
LIFO provision 195 131 87 109 62
Gain on sale of Walgreens Health Initiatives, Inc. – (273) – – –
Medicare Part D – – 43 – –
Net Earnings – as adjusted (Non-GAAP) $ 2,565 $ 2,710 $ 2,337 $ 2,209 $ 2,287
Net Earnings – as adjusted growth (Non-GAAP) (5.4%)
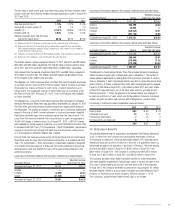
Net Earnings per Common Share (diluted) – as reported $ 2.42 $ 2.94
Alliance Boots transaction costs 0.09 –
Alliance Boots share issuance effect 0.02 –
Acquisition-related amortization 0.18 0.15
LIFO provision 0.22 0.14
Gain on sale of Walgreens Health Initiatives, Inc. – (0.30)
Net Earnings per Common Share (diluted) –
as adjusted (Non-GAAP) $ 2.93 $ 2.93
Net Earnings per Common Share (diluted) –
as adjusted growth (Non-GAAP) 0.0%
Selling, general and administrative expenses –
as reported $ 16,878 $ 16,561 $ 15,518 $ 14,366 $ 13,202 $ 12,093
Alliance Boots transaction costs (69) – – – – –
Acquisition-related amortization (255) (219) (182) (148) (107) (62)
Selling, general and administrative expenses –
as adjusted (Non-GAAP) $ 16,554 $ 16,342 $ 15,336 $ 14,218 $ 13,095 $ 12,031
Selling, general and administrative expense –
as adjusted growth (Non-GAAP) 1.3% 6.6% 7.9% 8.6% 8.8%
performance of the Company’s business from period to period and trends in the
Company’s historical operating results. The Company defines free cash flow as
net cash provided by operating activities in a period minus additions to property
and equipment (capital expenditures) made in that period. This measure does
not represent residual cash flows available for discretionary expenditures as the
measure does not deduct the payments required for debt service and other
contractual obligations or payments for future business acquisitions. Therefore,
the Company believes it is important to view free cash flow as a measure that
provides supplemental information to our entire statements of cash flows. These
supplemental non-GAAP financial measures should not be considered superior
to, as a substitute for, or as an alternative to, and should be considered in
conjunction with, the GAAP financial measures presented in the Annual Report.