Walgreens 2012 Annual Report Download - page 32
Download and view the complete annual report
Please find page 32 of the 2012 Walgreens annual report below. You can navigate through the pages in the report by either clicking on the pages listed below, or by using the keyword search tool below to find specific information within the annual report.-
 1
1 -
2
-
3
-
4
-
5
-
6
-
7
-
8
-
9
-
10
-
11
-
12
-
13
-
14
-
15
-
16
-
17
-
18
-
19
-
20
-
21
-
 22
22 -
 23
23 -
 24
24 -
 25
25 -
 26
26 -
 27
27 -
 28
28 -
 29
29 -
 30
30 -
 31
31 -
 32
32 -
 33
33 -
 34
34 -
 35
35 -
 36
36 -
 37
37 -
 38
38 -
 39
39 -
 40
40 -
 41
41 -
 42
42 -
43
-
44
-
45
-
46
-
47
-
48
 |
 |

30 2012 Walgreens Annual Report
1. Summary of Major Accounting Policies
Description of Business
The Company is principally in the retail drugstore business and its operations are
within one reportable segment. At August 31, 2012, there were 8,385 drugstore
and other locations in all 50 states, the District of Columbia, Guam and Puerto Rico.
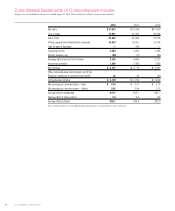
Prescription sales were 63.2% of total sales for fiscal 2012 compared to 64.7%
in 2011 and 65.2% in 2010.
Basis of Presentation
The consolidated financial statements include the accounts of the Company and its
subsidiaries. All intercompany transactions have been eliminated. The consolidated
financial statements are prepared in accordance with accounting principles generally
accepted in the United States of America and include amounts based on management’s
prudent judgments and estimates. Actual results may differ from these estimates.
Cash and Cash Equivalents
Cash and cash equivalents include cash on hand and all highly liquid investments
with an original maturity of three months or less. Credit and debit card receivables
from banks, which generally settle within two business days, of $88 million and $83
million were included in cash and cash equivalents at August 31, 2012 and 2011,
respectively. At August 31, 2012 and 2011, the Company had $820 million and
$1,239 million, respectively, in money market funds, all of which was included in
cash and cash equivalents.
The Company’s cash management policy provides for controlled disbursement.
As a result, the Company had outstanding checks in excess of funds on deposit
at certain banks. These amounts, which were $256 million at August 31, 2012,
and $229 million at August 31, 2011, are included in trade accounts payable
in the accompanying Consolidated Balance Sheets.
In fiscal 2011, the Company held $191 million in restricted cash to support certain
insurance obligations. In fiscal 2012, the restricted cash was released and the
obligations were supported by issued letters of credit.
Inventories
Inventories are valued on a lower of last-in, first-out (LIFO) cost or market basis.
At August 31, 2012 and 2011, inventories would have been greater by $1,897 million
and $1,587 million, respectively, if they had been valued on a lower of first-in,
first-out (FIFO) cost or market basis. As a result of declining inventory levels,
the fiscal 2012 LIFO provision was reduced by $268 million of LIFO liquidation.
Inventory includes product costs, inbound freight, warehousing costs and vendor
allowances not classified as a reduction of advertising expense.
Equity Method Investments
The Company uses the equity method to account for investments in companies if
the investment provides the ability to exercise significant influence, but not control,
over operating and financial policies of the investee. The Company’s proportionate
share of the net income or loss of these companies is included in consolidated
net earnings. Judgment regarding the level of influence over each equity method
investment includes considering key factors such as the Company’s ownership
interest, representation on the board of directors, participation in policy-making
decisions and material intercompany transactions.
Property and Equipment
Depreciation is provided on a straight-line basis over the estimated useful lives of
owned assets. Leasehold improvements and leased properties under capital leases
are amortized over the estimated useful life of the property or over the term of the
lease, whichever is shorter. Estimated useful lives range from 10 to 39 years for
land improvements, buildings and building improvements; and 2 to 13 years for
equipment. Major repairs, which extend the useful life of an asset, are capitalized;
routine maintenance and repairs are charged against earnings. The majority of the
business uses the composite method of depreciation for equipment. Therefore,
gains and losses on retirement or other disposition of such assets are included
in earnings only when an operating location is closed, completely remodeled or
impaired. Fully depreciated property and equipment are removed from the cost
and related accumulated depreciation and amortization accounts.
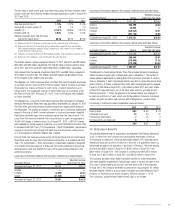
Property and equipment consists of (In millions) :
2012 2011
Land and land improvements
Owned locations $ 3,189 $ 3,209
Distribution centers 96 96
Other locations 232 240
Buildings and building improvements
Owned locations 3,684 3,651
Leased locations (leasehold improvements only) 1,518 1,235
Distribution centers 608 596
Other locations 525 372
Equipment
Locations 4,995 4,468
Distribution centers 1,158 1,098
Other locations 586 423
Capitalized system development costs 420 328
Capital lease properties 149 118
17,160 15,834
Less: accumulated depreciation and amortization 5,122 4,308
$ 12,038 $ 11,526
Depreciation expense for property and equipment was $841 million in fiscal 2012,
$809 million in fiscal 2011 and $804 million in fiscal 2010.
The Company capitalizes application stage development costs for significant
internally developed software projects, such as upgrades to the store point-of-sale
system. These costs are amortized over a five-year period. Amortization
expense was $70 million in fiscal 2012, $58 million in fiscal 2011 and
$44 million in fiscal 2010. Unamortized costs at August 31, 2012 and 2011,
were $292 million and $230 million, respectively.
Goodwill and Other Intangible Assets
Goodwill represents the excess of the purchase price over the fair value of assets
acquired and liabilities assumed. The Company accounts for goodwill and intangibles
under ASC Topic 350, Intangibles – Goodwill and Other, which does not permit
amortization, but requires the Company to test goodwill and other indefinite-lived
assets for impairment annually or whenever events or circumstances indicate
impairment may exist.
Impaired Assets and Liabilities for Store Closings
The Company tests long-lived assets for impairment whenever events or circum-
stances indicate that a certain asset may be impaired. Store locations that have
been open at least five years are reviewed for impairment indicators at least annually.
Once identified, the amount of the impairment is computed by comparing the
carrying value of the assets to the fair value, which is based on the discounted
estimated future cash flows. Impairment charges included in selling, general and
administrative expenses were $27 million in fiscal 2012, $44 million in fiscal
2011 and $17 million in fiscal 2010.
The Company also provides for future costs related to closed locations. The liability
is based on the present value of future rent obligations and other related costs
(net of estimated sublease rent) to the first lease option date. The reserve for store
closings was $117 million, $145 million and $151 million in fiscal 2012, 2011 and
2010, respectively. See Note 3 for additional disclosure regarding the Company’s
reserve for future costs related to closed locations.
Financial Instruments
The Company had $157 million and $143 million of outstanding letters of credit at
August 31, 2012 and 2011, respectively, which guarantee the purchase of foreign
goods, and additional outstanding letters of credit of $38 million and $40 million at
August 31, 2012 and 2011, respectively, which guarantee payments of insurance
claims. The insurance claim letters of credit are annually renewable and will remain
in place until the insurance claims are paid in full. Letters of credit of $229 million
and $13 million were outstanding at August 31, 2012, and August 31, 2011,
Notes to Consolidated Financial Statements