Walgreens 2012 Annual Report Download - page 28
Download and view the complete annual report
Please find page 28 of the 2012 Walgreens annual report below. You can navigate through the pages in the report by either clicking on the pages listed below, or by using the keyword search tool below to find specific information within the annual report.-
 1
1 -
2
-
3
-
4
-
5
-
6
-
7
-
8
-
9
-
10
-
11
-
12
-
13
-
14
-
15
-
16
-
17
-
 18
18 -
 19
19 -
 20
20 -
 21
21 -
 22
22 -
 23
23 -
 24
24 -
 25
25 -
 26
26 -
 27
27 -
 28
28 -
 29
29 -
 30
30 -
 31
31 -
 32
32 -
 33
33 -
 34
34 -
 35
35 -
 36
36 -
 37
37 -
 38
38 -
39
-
40
-
41
-
42
-
43
-
44
-
45
-
46
-
47
-
48
 |
 |

26 2012 Walgreens Annual Report
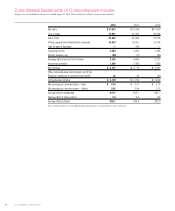
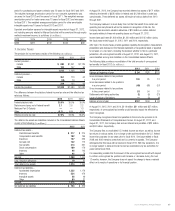
Consolidated Statements of Comprehensive Income
Walgreen Co. and Subsidiaries for the years ended August 31, 2012, 2011 and 2010 (In millions, except per share amounts)
2012 2011 2010
Net sales $ 71,633 $ 72,184 $ 67,420
Cost of sales 51,291 51,692 48,444
Gross Profit 20,342 20,492 18,976
Selling, general and administrative expenses 16,878 16,561 15,518
Gain on sale of business — 434 —
Operating Income 3,464 4,365 3,458
Interest expense, net (88) (71) (85)
Earnings Before Income Tax Provision 3,376 4,294 3,373
Income tax provision 1,249 1,580 1,282
Net Earnings $ 2,127 $ 2,714 $ 2,091
Other comprehensive income (loss), net of tax:
Reduction (addition) of postretirement liability 52 40 (61)
Comprehensive Income $ 2,179 $ 2,754 $ 2,030
Net earnings per common share – basic $ 2.43 $ 2.97 $ 2.13
Net earnings per common share – diluted 2.42 2.94 2.12
Average shares outstanding 874.7 915.1 981.7
Dilutive effect of stock options 5.4 9.4 6.2
Average diluted shares 880.1 924.5 987.9
The accompanying Notes to Consolidated Financial Statements are integral parts of these statements.