Walgreens 2013 Annual Report Download - page 21
Download and view the complete annual report
Please find page 21 of the 2013 Walgreens annual report below. You can navigate through the pages in the report by either clicking on the pages listed below, or by using the keyword search tool below to find specific information within the annual report.-
 1
1 -
2
-
3
-
4
-
5
-
6
-
7
-
8
-
9
-
10
-
 11
11 -
 12
12 -
 13
13 -
 14
14 -
 15
15 -
 16
16 -
 17
17 -
 18
18 -
 19
19 -
 20
20 -
 21
21 -
 22
22 -
 23
23 -
 24
24 -
 25
25 -
 26
26 -
 27
27 -
 28
28 -
 29
29 -
 30
30 -
 31
31 -
32
-
33
-
34
-
35
-
36
-
37
-
38
-
39
-
40
-
41
-
42
-
43
-
44
-
45
-
46
-
47
-
48
-
49
-
50
 |
 |

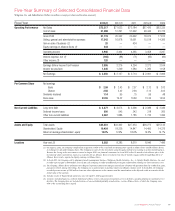
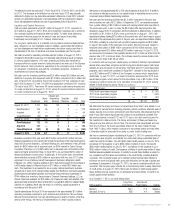
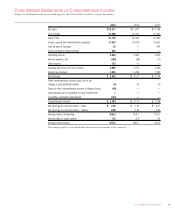
Five-Year Summary of Selected Consolidated Financial Data
Walgreen Co. and Subsidiaries (Dollars in millions, except per share and location amounts)
Fiscal Year 2013(1) 2012(1) 2011 2010(4) 2009
Operating Performance Net Sales $ 72,217 $ 71,633 $ 72,184 $ 67,420 $ 63,335
Cost of sales 51,098 51,291 51,692 48,444 45,722
Gross Profit 21,119 20,342 20,492 18,976 17,613
Selling, general and administrative expenses 17,543 16,878 16,561 15,518 14,366
Gain on sale of business (2) 20 — 434 — —
Equity earnings in Alliance Boots (1) 344 — — — —
Operating Income 3,940 3,464 4,365 3,458 3,247
Interest expense, net (1) (165) (88) (71) (85) (83)
Other income (3) 120 — — — —
Earnings Before Income Tax Provision 3,895 3,376 4,294 3,373 3,164
Income tax provision 1,445 1,249 1,580 1,282 1,158
Net Earnings $ 2,450 $ 2,127 $ 2,714 $ 2,091 $ 2,006
Per Common Share Net earnings
Basic $ 2.59 $ 2.43 $ 2.97 $ 2.13 $ 2.03
Diluted 2.56 2.42 2.94 2.12 2.02
Dividends declared 1.14 .95 .75 .59 .48
Book value 20.55 19.32 16.69 15.34 14.54
Non-Current Liabilities Long-term debt $ 4,477 $ 4,073 $ 2,396 $ 2,389 $ 2,336
Deferred income taxes 600 545 343 318 265
Other non-current liabilities 2,067 1,886 1,785 1,735 1,396
Assets and Equity Total Assets $ 35,481 $ 33,462 $ 27,454 $ 26,275 $ 25,142
Shareholders’ Equity 19,454 18,236 14,847 14,400 14,376
Return on average shareholders’ equity 13.0% 12.9% 18.6% 14.5% 14.7%
Locations Year-end (5) 8,582 8,385 8,210 8,046 7,496
(1) On August 2, 2012, the Company completed the acquisition of 45% of the issued and outstanding share capital of Alliance Boots GmbH (Alliance Boots)
in exchange for cash and Company shares. The Company accounts for this investment using the equity method of accounting on a three-month lag basis.
Because the closing of this investment occurred in August 2012, our financial statements for fiscal 2013 reflect 12 months of the dilutive effect of the
incremental shares and interest expense associated with our Alliance Boots investment, but only 10 months (August 2012 through May 2013) of
Alliance Boots results, reported as Equity earnings in Alliance Boots.
(2) In fiscal 2011, the Company sold its pharmacy benefit management business, Walgreens Health Initiatives, Inc., to Catalyst Health Solutions, Inc. and
recorded a pre-tax gain of $434 million. In fiscal 2013, the Company recorded an additional pre-tax gain of $20 million relating to a client retention escrow.
(3) The Company, Alliance Boots and AmerisourceBergen Corporation (AmerisourceBergen) entered into a Framework Agreement dated as of March 18, 2013,
pursuant to which, among other things, the Company was issued warrants to purchase AmerisourceBergen common stock. In fiscal 2013, the Company
recorded pre-tax income of $120 million from fair value adjustments of the warrants and the amortization of the deferred credit associated with the
initial value of the warrants.
(4) Includes results of Duane Reade operations since the April 9, 2010 acquisition date.
(5) Locations include drugstores, worksite health and wellness centers, infusion and respiratory services facilities, specialty pharmacies and mail service
facilities. The foregoing does not include locations of unconsolidated partially owned entities, such as Alliance Boots, of which the Company owns
45% of the outstanding share capital.
2013 Walgreens Annual Report 19