Walgreens 2013 Annual Report Download - page 40
Download and view the complete annual report
Please find page 40 of the 2013 Walgreens annual report below. You can navigate through the pages in the report by either clicking on the pages listed below, or by using the keyword search tool below to find specific information within the annual report.-
 1
1 -
2
-
3
-
4
-
5
-
6
-
7
-
8
-
9
-
10
-
11
-
12
-
13
-
14
-
15
-
16
-
17
-
18
-
19
-
20
-
21
-
22
-
23
-
24
-
25
-
26
-
27
-
28
-
29
-
 30
30 -
 31
31 -
 32
32 -
 33
33 -
 34
34 -
 35
35 -
 36
36 -
 37
37 -
 38
38 -
 39
39 -
 40
40 -
 41
41 -
 42
42 -
 43
43 -
 44
44 -
 45
45 -
 46
46 -
 47
47 -
 48
48 -
 49
49 -
 50
50
 |
 |

Notes to Consolidated Financial Statements (continued)
38 2013 Walgreens Annual Report
Changes in assumptions concerning future financial results or other underlying
assumptions could have a significant impact on either the fair value of the reporting
units, the amount of the goodwill impairment charge, or both. The Company
also compared the sum of the estimated fair values of its reporting units to the
Company’s total value as implied by the market value of its equity and debt
securities. This comparison indicated that, in total, its assumptions and estimates
were reasonable. However, future declines in the overall market value of the
Company’s equity and debt securities may indicate that the fair value of one
or more reporting units has declined below its carrying value.
One measure of the sensitivity of the amount of goodwill impairment charges to key
assumptions is the amount by which each reporting unit “passed” (fair value exceeds
the carrying amount) or “failed” (the carrying amount exceeds fair value) the first step
of the goodwill impairment test. The Company’s reporting units’ fair values exceeded
their carrying amounts ranging from approximately 15% to more than 180%.
Generally, changes in estimates of expected future cash flows would have a similar
effect on the estimated fair value of the reporting unit. That is, a 1% change in esti-
mated future cash flows would change the estimated fair value of the reporting unit
by approximately 1%. The estimated long-term rate of net sales growth can have a
significant impact on the estimated future cash flows, and therefore, the fair value
of each reporting unit. Of the other key assumptions that impact the estimated fair
values, most reporting units have the greatest sensitivity to changes in the estimated
discount rate. The Company believes that its estimates of future cash flows and
discount rates are reasonable, but future changes in the underlying assumptions
could differ due to the inherent uncertainty in making such estimates.
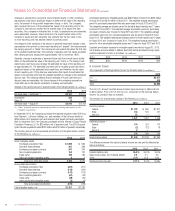
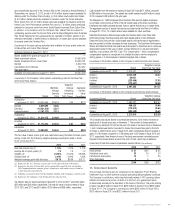
Changes in the carrying amount of goodwill consist of the following activity (In millions):
2013 2012
Net book value – September 1 $ 2,161 $ 2,017
Acquisitions 236 120
Other (1) 13 24
Net book value – August 31 $ 2,410 $ 2,161
(1) “Other” primarily represents immaterial purchase accounting adjustments for the
Company’s acquisitions.
In September 2012, the Company purchased the regional drugstore chain USA Drug
from Stephen L. LaFrance Holdings, Inc. and members of the LaFrance family for
$436 million net of assumed cash and selected other assets (primarily prescription
files). In December 2012, the Company purchased an 80% interest in Cystic Fibrosis
Foundation Pharmacy LLC for $29 million, net of assumed cash. The USA Drug and
Cystic Fibrosis acquisitions added $220 million and $16 million of goodwill, respectively.
The carrying amount and accumulated amortization of intangible assets consists
of the following (In millions):
2013 2012
Gross Intangible Assets
Purchased prescription files $ 1,099 $ 984
Favorable lease interests 381 388
Purchasing and payer contracts 347 334
Non-compete agreements 153 120
Trade name 199 189
Other amortizable intangible assets 4 4
Total gross intangible assets 2,183 2,019
Accumulated amortization
Purchased prescription files (467) (417)
Favorable lease interests (143) (109)
Purchasing and payer contracts (147) (119)
Non-compete agreements (67) (53)
Trade name (49) (32)
Other amortizable intangible assets (3) (3)
Total accumulated amortization (876) (733)
Total intangible assets, net $ 1,307 $ 1,286
Amortization expense for intangible assets was $289 million in fiscal 2013, $255 million
in fiscal 2012 and $219 million in fiscal 2011. The weighted-average amortization
period for purchased prescription files was seven years for fiscal 2013 and 2012.
The weighted-average amortization period for favorable lease interests was 11 years
for fiscal 2013 and 2012. The weighted-average amortization period for purchasing
and payer contracts was 13 years for fiscal 2013 and 2012. The weighted-average
amortization period for non-compete agreements was six years for fiscal 2013 and
fiscal 2012. The weighted-average amortization period for trade names was 12 years
for fiscal 2013 and 13 years for fiscal 2012. The weighted-average amortization
period for other amortizable intangible assets was 10 years for fiscal 2013 and 2012.
Expected amortization expense for intangible assets recorded at August 31, 2013,
not including amounts related to Alliance Boots that will be amortized through equity
method investment income, is as follows (In millions) :
2014 2015 2016 2017 2018
$257 $225 $185 $144 $99
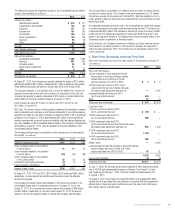
8. Income Taxes
The components of Earnings Before Income Tax Provision were (In millions):
2013
U.S. $ 3,477
Non-U.S. 418
Total $ 3,895
The non-U.S. amount reported above includes equity earnings in Alliance Boots
of $344 million. Prior to 2013, the non-U.S. component of the Earnings Before
Income Tax provision was not material.
The provision for income taxes consists of the following (In millions):
2013 2012 2011
Current provision –
Federal $ 1,122 $ 890 $ 1,301
State 134 120 147
Non-U.S. 15 — —
1,271 1,010 1,448
Deferred provision –
Federal 174 251 113
State (2) (12) 19
Non-U.S. 2 — —
174 239 132
Income tax provision $ 1,445 $ 1,249 $ 1,580
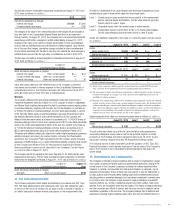
The difference between the statutory federal income tax rate and the effective tax
rate is as follows:
2013 2012 2011
Federal statutory rate 35.0 % 35.0 % 35.0 %
State income taxes, net of federal benefit 2.2 2.1 2.6
Other (0.1) (0.1) (0.8)
Effective income tax rate 37.1 % 37.0% 36.8%