Walgreens 2013 Annual Report Download - page 3
Download and view the complete annual report
Please find page 3 of the 2013 Walgreens annual report below. You can navigate through the pages in the report by either clicking on the pages listed below, or by using the keyword search tool below to find specific information within the annual report.-
 1
1 -
 2
2 -
 3
3 -
 4
4 -
 5
5 -
 6
6 -
 7
7 -
 8
8 -
 9
9 -
 10
10 -
 11
11 -
 12
12 -
 13
13 -
 14
14 -
15
-
16
-
17
-
18
-
19
-
20
-
21
-
22
-
23
-
24
-
25
-
26
-
27
-
28
-
29
-
30
-
31
-
32
-
33
-
34
-
35
-
36
-
37
-
38
-
39
-
40
-
41
-
42
-
43
-
44
-
45
-
46
-
47
-
48
-
49
-
50
 |
 |
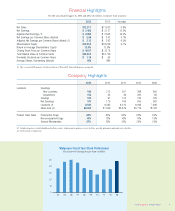
2013 2012 Increase
Net Sales $72,217 $ 71,633 0.8%
Net Earnings $ 2,450 $ 2,127 15.2%
Adjusted Net Earnings (1) $ 2,982 $ 2,565 16.3%
Net Earnings per Common Share (diluted) $ 2.56 $ 2.42 5.7%
Adjusted Net Earnings per Common Share (diluted) (1) $ 3.12 $ 2.93 6.5%
Shareholders’ Equity $19,454 $ 18,236 6.7%
Return on Average Shareholders’ Equity 13.0% 12.9%
Closing Stock Price per Common Share $ 48.07 $ 35.76
Total Market Value of Common Stock $45,503 $ 33,759
Dividends Declared per Common Share $ 1.14 $ .95
Average Shares Outstanding (diluted) 955 880
(1) This is a non-GAAP measure. See Reconciliation of Non-GAAP Financial Measures on page 46.
2013 2012 2011 2010 2009
Locations Openings
New Locations 198 212 261 388 602
Acquisitions 152 54 36 282 89
Closings 153 91 133 120 129
Net Openings 197 175 164 550 562
Locations (1) 8,582 8,385 8,210 8,046 7,496
Sales Area (2) 88,802 87,049 85,619 83,719 78,782
Product Class Sales Prescription Drugs 63% 63% 65% 65% 65%
Non-prescription Drugs 10% 12% 10% 10% 10%
General Merchandise 27% 25% 25% 25% 25%
(1) Includes drugstores, worksite health and wellness centers, infusion and respiratory services facilities, specialty pharmacies and mail service facilities.
(2) In thousands of square feet.
Financial Highlights
For the years ended August 31, 2013 and 2012 (In millions, except per share amounts)
Company Highlights
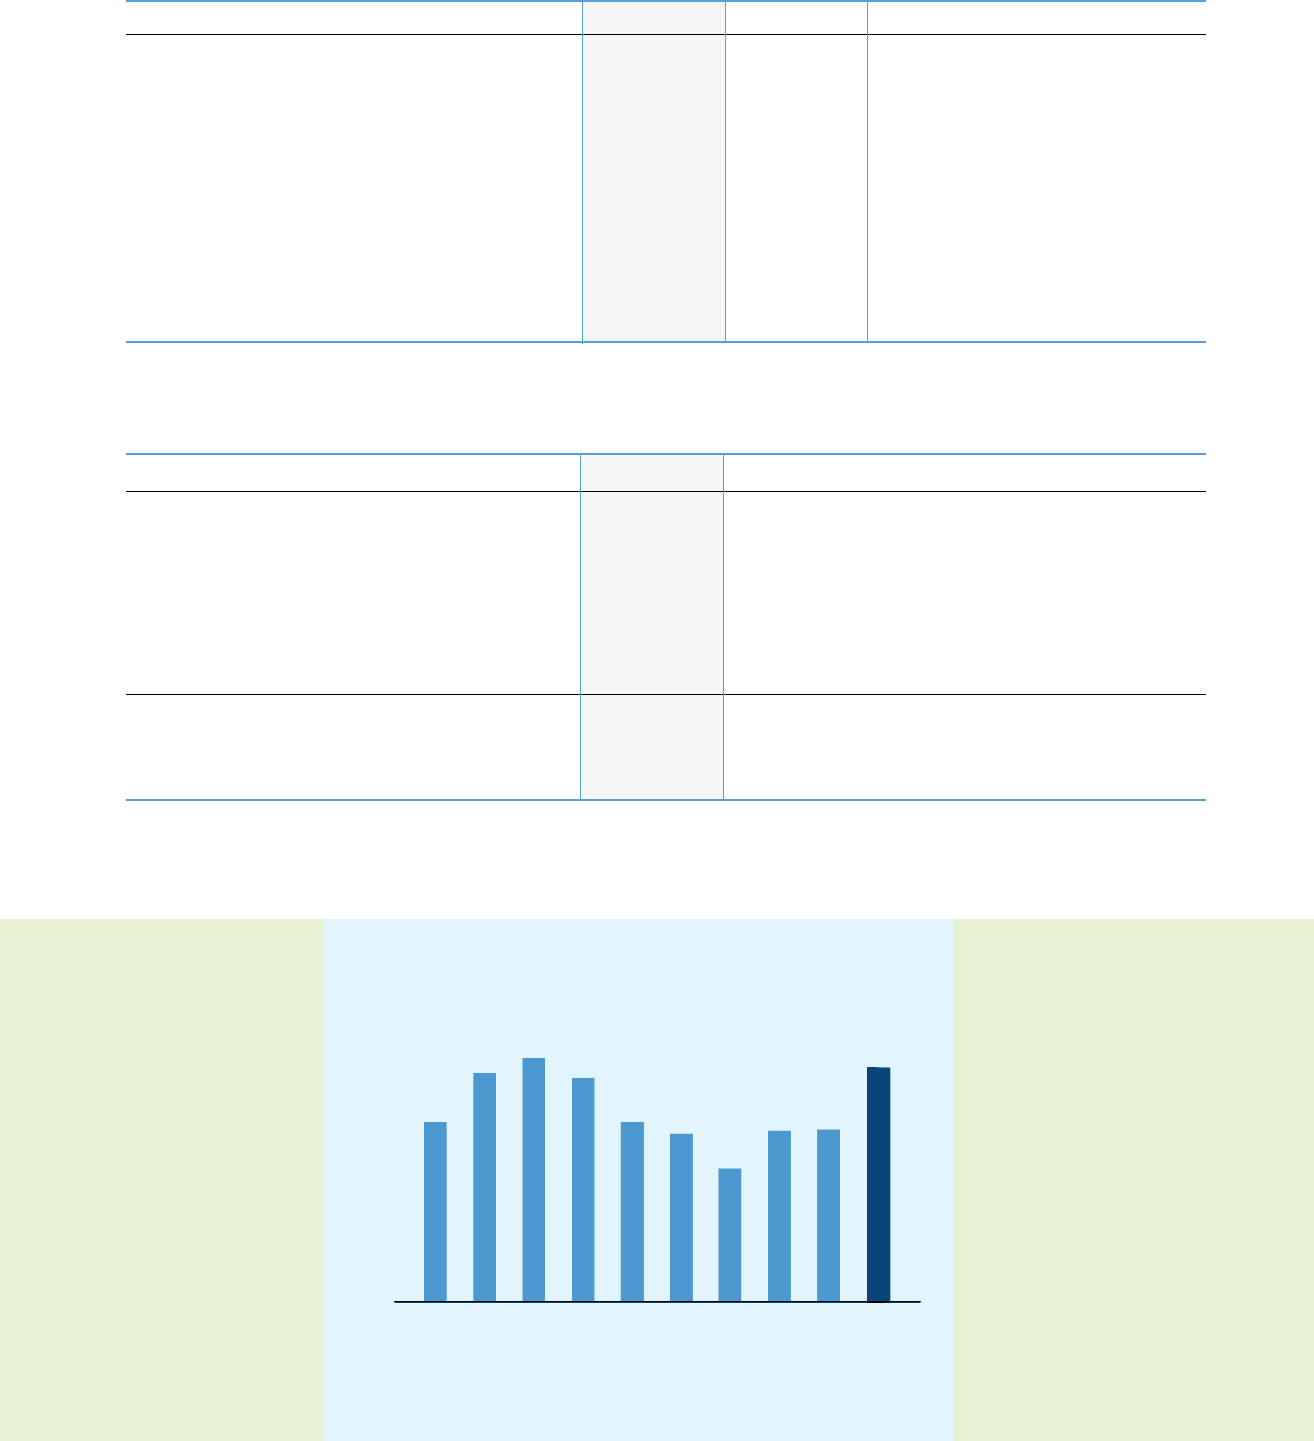
13121110090807060504
50
40
30
20
10
0
Walgreens Fiscal Year Stock Performance
Fiscal year-end closing price per share in dollars
2013 Walgreens Annual Report 1