Walgreens 2013 Annual Report Download - page 31
Download and view the complete annual report
Please find page 31 of the 2013 Walgreens annual report below. You can navigate through the pages in the report by either clicking on the pages listed below, or by using the keyword search tool below to find specific information within the annual report.-
 1
1 -
2
-
3
-
4
-
5
-
6
-
7
-
8
-
9
-
10
-
11
-
12
-
13
-
14
-
15
-
16
-
17
-
18
-
19
-
20
-
 21
21 -
 22
22 -
 23
23 -
 24
24 -
 25
25 -
 26
26 -
 27
27 -
 28
28 -
 29
29 -
 30
30 -
 31
31 -
 32
32 -
 33
33 -
 34
34 -
 35
35 -
 36
36 -
 37
37 -
 38
38 -
 39
39 -
 40
40 -
 41
41 -
42
-
43
-
44
-
45
-
46
-
47
-
48
-
49
-
50
 |
 |

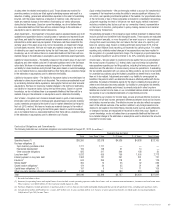
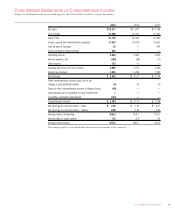
Consolidated Statements of Comprehensive Income
Walgreen Co. and Subsidiaries for the years ended August 31, 2013, 2012 and 2011 (In millions, except per share amounts)
2013 2012 2011
Net sales $ 72,217 $ 71,633 $ 72,184
Cost of sales 51,098 51,291 51,692
Gross Profit 21,119 20,342 20,492
Selling, general and administrative expenses 17,543 16,878 16,561
Gain on sale of business 20 — 434
Equity earnings in Alliance Boots 344 — —
Operating Income 3,940 3,464 4,365
Interest expense, net (165) (88) (71)
Other income 120 — —
Earnings Before Income Tax Provision 3,895 3,376 4,294
Income tax provision 1,445 1,249 1,580
Net Earnings $ 2,450 $ 2,127 $ 2,714
Other comprehensive income (loss), net of tax:
Change in postretirement liability (5) 52 40
Share of other comprehensive income of Alliance Boots (59) — —
Unrecognized gain on available-for-sale investments 1 — —
Cumulative translation adjustments (103) — —
Comprehensive Income $ 2,284 $ 2,179 $ 2,754
Net earnings per common share – basic $ 2.59 $ 2.43 $ 2.97
Net earnings per common share – diluted 2.56 2.42 2.94
Average shares outstanding 946.0 874.7 915.1
Dilutive effect of stock options 9.2 5.4 9.4
Average diluted shares 955.2 880.1 924.5
The accompanying Notes to Consolidated Financial Statements are integral parts of these statements.
2013 Walgreens Annual Report 29