Walgreens 2013 Annual Report Download - page 25
Download and view the complete annual report
Please find page 25 of the 2013 Walgreens annual report below. You can navigate through the pages in the report by either clicking on the pages listed below, or by using the keyword search tool below to find specific information within the annual report.-
 1
1 -
2
-
3
-
4
-
5
-
6
-
7
-
8
-
9
-
10
-
11
-
12
-
13
-
14
-
 15
15 -
 16
16 -
 17
17 -
 18
18 -
 19
19 -
 20
20 -
 21
21 -
 22
22 -
 23
23 -
 24
24 -
 25
25 -
 26
26 -
 27
27 -
 28
28 -
 29
29 -
 30
30 -
 31
31 -
 32
32 -
 33
33 -
 34
34 -
 35
35 -
36
-
37
-
38
-
39
-
40
-
41
-
42
-
43
-
44
-
45
-
46
-
47
-
48
-
49
-
50
 |
 |

The effective income tax rate was 37.1% for fiscal 2013, 37.0% for 2012, and 36.8%
for 2011. The increase in the effective tax rate from fiscal 2012 was primarily
attributed to higher non-tax deductible permanent differences. Fiscal 2012 included
certain non-deductible transaction costs associated with the investment in Alliance
Boots. We anticipate an effective tax rate of approximately 36% in fiscal 2014.
Liquidity and Capital Resources
Cash and cash equivalents were $2.1 billion at August 31, 2013, compared to
$1.3 billion at August 31, 2012. Short-term investment objectives are to minimize
risk, maintain liquidity and maximize after-tax yields. To attain these objectives,
investment limits are placed on the amount, type and issuer of securities.
Investments are principally in U.S. Treasury market funds.
Our long-term capital policy is to maintain a strong balance sheet and financial flexi-
bility; reinvest in our core strategies; invest in strategic opportunities that reinforce
our core strategies and meet return requirements; and return surplus cash flow to
shareholders in the form of dividends and share repurchases over the long term.
Net cash provided by operating activities was $4.3 billion at August 31, 2013,
compared to $4.4 billion a year ago. The decrease was primarily a result of changes
in working capital balances. Prior year operating activities also benefited by
increased efforts to reduce inventory during the period we were out of the Express
Scripts network. Cash provided by operations is the principal source of funds
for expansion, investments, acquisitions, remodeling programs, dividends to
shareholders and stock repurchases.
Net cash used for investing activities was $2.0 billion versus $5.9 billion last year.
Additions to property and equipment were $1.2 billion compared to $1.6 billion last
year. In fiscal 2013, we added a total of 350 locations (197 net) compared to last
year’s 266 locations (175 net). The USA Drug acquisition contributed 141 locations
(70 net) in fiscal 2013. There were 39 owned locations added during the year and
41 under construction at August 31, 2013, versus 34 owned locations added and
41 under construction as of August 31, 2012.
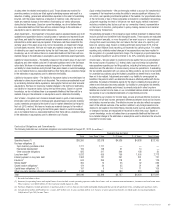
Infusion and
Work- Respiratory Specialty Mail
Drugstores sites Services Pharmacy Service Total
August 31, 2011 7,761 355 83 9 2 8,210
New/Relocated 169 36 5 2 — 212
Acquired 43 — 10 1 — 54
Closed/Replaced (43) (25) (22) (1) — (91)
August 31, 2012 7,930 366 76 11 2 8,385
New/Relocated 172 14 10 2 — 198
Acquired 147 — 1 4 — 152
Closed/Replaced (133) (9) (5) (6) — (153)
August 31, 2013 8,116 371 82 11 2 8,582
Business acquisitions this year were $630 million versus $491 million last year.
Business acquisitions in the current year include the purchase of the regional drugstore
chain USA Drug from Stephen L. LaFrance Holdings, Inc. and members of the LaFrance
family for $436 million net of assumed cash, an 80% interest in Cystic Fibrosis
Foundation Pharmacy, LLC for $29 million net of assumed cash, and selected other
assets (primarily prescription files). In fiscal 2013, we purchased $224 million of
AmerisourceBergen common stock. Additionally, in the current year, we received
client retention proceeds of $20 million in accordance with the June 2011 sales
agreement of our pharmacy benefit management business, Walgreens Health
Initiatives, Inc. (WHI). Investing activities in 2012 include the August 2012 purchase of
a 45% equity interest in Alliance Boots for $7.0 billion, of which $4.0 billion was
cash. This investment is accounted for as an equity method investment. Business
acquisitions in fiscal 2012 included certain assets from BioScrip’s community specialty
pharmacies and centralized specialty and mail services pharmacy businesses for
$144 million plus inventory; the purchase of Crescent Pharmacy Holdings, LLC, an
infusion pharmacy business, for $73 million, net of assumed cash; and selected other
assets (primarily prescription files). In fiscal 2012, we paid $45 million to Catalyst Health
Solutions Inc. (Catalyst), which was the result of a working capital adjustment in
accordance with the sale of WHI.
Capital expenditures for fiscal 2014 are expected to be approximately $1.4 billion,
excluding business acquisitions, joint ventures and prescription file purchases,
although the actual amount may vary depending upon a variety of factors, including,
among other things, the timing of implementation of certain capital projects.
We expect to add approximately 85 to 160 new drugstores in fiscal 2014. In addition,
we continue to allocate a portion of our capital budget to relocating stores to more
convenient and profitable freestanding locations.
Net cash used by financing activities was $1.5 billion compared to the prior year
which provided net cash of $1.2 billion. In September 2012, we received proceeds
from a public offering of $4.0 billion of notes with varying interest rates (see Note 9).
The notes were used, in part, to repay the $3.0 billion 364-day bridge term loan
obtained in August 2012 in connection with the investment in Alliance Boots. In addition,
we repaid our $1.3 billion 4.875% notes upon maturity on August 1, 2013. We
repurchased shares totaling $615 million in the current year, all of which was to support
the needs of the employee stock plans. In the prior year, we repurchased shares totaling
$1.2 billion, primarily in conjunction with our share buyback programs and $40 million
to support the needs of the employee stock plans. We had proceeds related to
employee stock plans of $486 million compared to $165 million last year. Cash
dividends paid were $1.0 billion versus $787 million a year ago. On July 10, 2013,
we announced an increase in the quarterly dividend to 31.5 cents per share from the
previous rate of 27.5 cents per share. The increase raises the annual dividend rate
from $1.10 per share to $1.26 per share.
In connection with our long-term capital policy, our Board of Directors has authorized
several share repurchase programs and set a long-term dividend payout ratio target
between 30 and 35 percent of net earnings. The 2009 and 2011 stock repurchase
programs, which were both completed in fiscal 2011, allowed for the repurchase of
up to $2.0 billion and $1.0 billion of the Company’s common stock, respectively.
Additionally, on July 13, 2011, our Board of Directors authorized the 2012 stock
repurchase program, which allows for the repurchase of up to $2.0 billion of the
Company’s common stock prior to its expiration on December 31, 2015. Activity
related to these programs was as follows (In millions):
Fiscal Year Ended 2013 2012 2011
2009 stock repurchase program $ — $ — $ 360
2011 stock repurchase program — — 1,000
2012 stock repurchase program — 1,151 424
$ — $ 1,151 $ 1,784
We determine the timing and amount of repurchases from time to time based on our
assessment of various factors including prevailing market conditions, alternate uses of
capital, liquidity, the economic environment and other factors. We anticipate that the
pace of any future share repurchase will continue to be significantly curtailed from
the levels achieved in fiscal 2012 and 2011 due to the debt levels incurred for
the investment in Alliance Boots. The timing and amount of these purchases may
change at any time and from time to time. The Company has repurchased and may
from time to time in the future repurchase shares on the open market through
Rule 10b5-1 plans, which enable a company to repurchase shares at times when
it otherwise might be precluded from doing so under insider trading laws.
We had no commercial paper outstanding at August 31, 2013. In connection with our
commercial paper program, we maintain two unsecured backup syndicated lines of
credit that total $1.35 billion. The first $500 million facility expires on July 20, 2015,
and allows for the issuance of up to $250 million in letters of credit. The second
$850 million facility expires on July 23, 2017, and allows for the issuance of up to
$200 million in letters of credit. The issuance of letters of credit under either of these
facilities reduces available borrowings. Our ability to access these facilities is subject to
our compliance with the terms and conditions of the credit facility, including financial
covenants. The covenants require us to maintain certain financial ratios related to
minimum net worth and priority debt, along with limitations on the sale of assets and
purchases of investments. At August 31, 2013, we were in compliance with all such
covenants. The Company pays a facility fee to the financing banks to keep these lines
of credit active. At August 31, 2013, there were no letters of credit issued against
these facilities and we currently do not anticipate any future letters of credit to be
issued against these facilities.
As of October 17, 2013, our credit ratings were:
Long-Term Commercial
Rating Agency Debt Rating Paper Rating Outlook
Moody’s Baa1 P-2 Negative
Standard & Poor’s BBB A-2 Stable
2013 Walgreens Annual Report 23