Walgreens 2013 Annual Report Download - page 23
Download and view the complete annual report
Please find page 23 of the 2013 Walgreens annual report below. You can navigate through the pages in the report by either clicking on the pages listed below, or by using the keyword search tool below to find specific information within the annual report.-
 1
1 -
2
-
3
-
4
-
5
-
6
-
7
-
8
-
9
-
10
-
11
-
12
-
 13
13 -
 14
14 -
 15
15 -
 16
16 -
 17
17 -
 18
18 -
 19
19 -
 20
20 -
 21
21 -
 22
22 -
 23
23 -
 24
24 -
 25
25 -
 26
26 -
 27
27 -
 28
28 -
 29
29 -
 30
30 -
 31
31 -
 32
32 -
 33
33 -
34
-
35
-
36
-
37
-
38
-
39
-
40
-
41
-
42
-
43
-
44
-
45
-
46
-
47
-
48
-
49
-
50
 |
 |
other things, reduce cost and improve productivity. In fiscal 2011, we recorded
$42 million of pre-tax charges in selling, general and administrative expenses
associated with the program. In total, we incurred $403 million of pre-tax charges
related to the program. We realized total savings related to Rewiring for Growth of
approximately $1.1 billion in fiscal 2011 compared to our base year of fiscal 2008.
Selling, general and administrative expenses realized total savings of $953 million,
while cost of sales benefited by approximately $122 million. The savings were
primarily the result of reduced store labor and personnel and expense reductions.
Additionally, as a part of our Customer Centric Retailing (CCR) initiative, we have
modified our store format to enhance category layouts and adjacencies, shelf heights
and sight lines, and brand and private brand assortments, all of which were designed
to positively impact the shopper experience. This initiative was completed in the
first quarter of fiscal 2012. In total, we converted 5,843 stores and opened 559
new stores with the CCR format. In fiscal 2012, we incurred $33 million in total
program costs, of which $15 million was included in selling, general and adminis-
trative expenses and $18 million in capital costs. In fiscal 2011, we incurred
$144 million in total program costs, of which $84 million was included in selling,
general and administrative expenses and $60 million in capital costs.
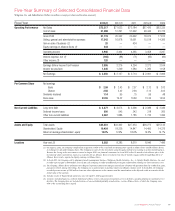
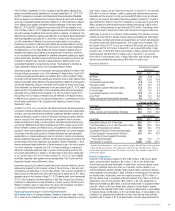
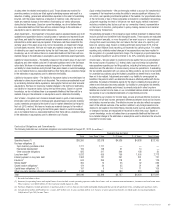
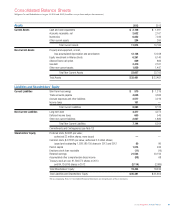
Operating Statistics
Percentage Increases/
(Decreases)
Fiscal Year 2013 2012 2011
Net Sales 0.8 (0.8) 7.1
Net Earnings 15.2 (21.6) 29.8
Comparable Drugstore Sales (1.3) (3.6) 3.3
Prescription Sales 0.4 (3.1) 6.3
Comparable Drugstore Prescription Sales (1.7) (6.1) 3.3
Front-End Sales 1.5 3.6 8.5
Comparable Drugstore Front-End Sales (0.7) 0.6 3.3
Gross Profit 3.8 (0.7) 8.0
Selling, General and Administrative Expenses 3.9 1.9 6.7
Percent to Net Sales
Fiscal Year 2013 2012 2011
Gross Margin 29.3 28.4 28.4
Selling, General and Administrative Expenses 24.3 23.6 23.0
Other Statistics
Fiscal Year 2013 2012 2011
Prescription Sales as a % of Net Sales 62.9 63.2 64.7
Third Party Sales as a % of Total Prescription Sales 95.8 95.6 95.6
Number of Prescriptions (in millions) 683 664 718
Comparable Prescription % Increase/(Decrease) 2.9 (8.4) 1.5
30-Day Equivalent Prescriptions (in millions)* 821 784 819
Comparable 30-Day Equivalent Prescription
% Increase/(Decrease)* 4.8 (5.1) 3.7
Total Number of Locations 8,582 8,385 8,210
* Includes the adjustment to convert prescriptions greater than 84 days to the equivalent
of three 30-day prescriptions. This adjustment reflects the fact that these prescriptions
include approximately three times the amount of product days supplied compared to a
normal prescription.
Results of Operations
Fiscal 2013 net earnings increased 15.2% to $2.5 billion, or $2.56 per diluted
share, versus last year’s earnings of $2.1 billion, or $2.42 per diluted share.
The increase was primarily attributable to higher sales, improved margins, equity
earnings in Alliance Boots and other non-operating income related to our
AmerisourceBergen warrants, partially offset by higher selling, general and adminis-
trative expenses as a percentage of sales. Included in net earnings and net earnings
per diluted share, respectively, were the negative impacts of $241 million, or
$.25 per diluted share, in acquisition-related amortization; $151 million, or $.16 per
diluted share, from the LIFO provision; $124 million, or $.13 per diluted share, in
Alliance Boots related tax; $60 million, or $.06 per diluted share, of acquisition-related
costs; $47 million, or $.05 per diluted share, relating to certain litigation matters
including the DEA settlement; $24 million, or $.03 per diluted share, in costs related
to Hurricane Sandy; and $8 million, or $.01 per diluted share, in costs related to the
completion of a pharmaceutical distribution contract. Net earnings were positively
impacted by $110 million, or $.12 per diluted share, from fair value adjustments of
Form 8-K filed on September 10, 2012, includes as exhibits thereto Alliance Boots
audited consolidated financial statements for the years ended March 31, 2012, 2011
and 2010 (prepared in accordance with International Financial Reporting Standards
(IFRS) as issued by the International Accounting Standards Board) and unaudited
pro forma consolidated financial information related to our 45% investment in Alliance
Boots. Alliance Boots audited consolidated financial statements for the years ended
March 31, 2013 and 2012 (prepared in accordance with IFRS) are available on our
Form 8-K filed on May 15, 2013. Walgreens equity earnings, initial investment and the
call option excludes the Alliance Boots minority interest in Galenica Ltd. (Galenica). The
Alliance Boots investment in Galenica was distributed to the Alliance Boots shareholders
other than Walgreens during May 2013, which had no impact to us. We account for
our 45% investment in Alliance Boots using the equity method of accounting.
Investments accounted for under the equity method are recorded initially at cost and
subsequently adjusted for our share of the net income or loss and cash contributions
and distributions to or from these entities. Net income reported by Alliance Boots is
translated from British pounds Sterling at the average rate for the period. See Note 5
to our consolidated financial statements for additional information regarding our equity
method investments. We utilize a three-month lag in reporting equity income from our
investment in Alliance Boots, reported as equity earnings in Alliance Boots on the
Consolidated Statements of Comprehensive Income. The investment is recorded as
Equity investment in Alliance Boots in the Consolidated Balance Sheets.
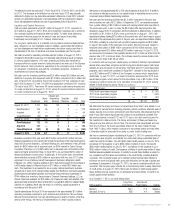
Combined synergies across both companies were approximately $154 million in the
first year following completion of our 45% investment in Alliance Boots. Fiscal 2014
combined synergies are estimated to be between $350 million and $400 million.
The three-month lag impacts the quarterly and fiscal year timing of when Alliance Boots
results and synergies will be reflected in the equity earnings in Alliance Boots included in
our financial statements. Because of the three-month lag and the timing of the closing
of this investment, our financial statements for the year ended August 31, 2013, reflect
twelve months of the dilutive effect of the incremental shares and interest expense
associated with our Alliance Boots investment, but only ten months (August 2012
through May 2013) of results of Alliance Boots are reflected in the equity earnings
in Alliance Boots included in our Consolidated Statements of Comprehensive Income
for the twelve-month period. See “Cautionary Note Regarding Forward-Looking
Statements” below.
On March 19, 2013, we, in conjunction with Alliance Boots and AmerisourceBergen
Corporation (AmerisourceBergen) announced various agreements and arrangements,
including a ten-year pharmaceutical distribution agreement between ourselves and
AmerisourceBergen pursuant to which we will source branded and generic pharma-
ceutical products from AmerisourceBergen; an agreement which provides
AmerisourceBergen the ability to access generics and related pharmaceutical prod-
ucts through Walgreens Boots Alliance Development GmbH, a global sourcing joint
venture between ourselves and Alliance Boots; and agreements and arrangements
pursuant to which we and Alliance Boots together have the right, but not the obligation,
to purchase a minority equity position in AmerisourceBergen and gain associated
representation on AmerisourceBergen’s board of directors in certain circumstances.
AmerisourceBergen has begun to distribute all branded pharmaceutical products that
we historically sourced from distributors and suppliers, effective September 1, 2013.
AmerisourceBergen began distribution of certain branded drugs in the fourth quarter.
Over time, beginning in calendar year 2014, AmerisourceBergen is expected to
distribute increasingly significant levels of generic pharmaceutical products that
we currently self-distribute. In addition to the information in this report, please refer
to our Current Report on Form 8-K filed on March 20, 2013, for more detailed
information regarding these agreements and arrangements. See “Cautionary Note
Regarding Forward-Looking Statements” below.
Investments accounted for under the equity method are recorded initially at cost and
subsequently adjusted for the Company’s share of the net income or loss and cash
contributions and distributions to or from these entities. The Company’s investment in
Alliance Boots and the related call option were recorded as assets with a $7.1 billion
aggregate value on the Company’s August 31, 2013 balance sheet, which represented
30.1% of the Company’s long-lived assets as of that date. Because the Company’s
investment in Alliance Boots is denominated in a foreign currency (British pounds
Sterling), translation gains or losses impact the value of the investment. See Note 5
to Consolidated Financial Statements for additional information.
Restructuring and Customer Centric Retailing Initiative
We completed one of our strategic initiatives to enhance shareholder value in fiscal
2011, known as the “Rewiring for Growth” program, which was designed to, among
2013 Walgreens Annual Report 21