Walgreens 2013 Annual Report Download - page 35
Download and view the complete annual report
Please find page 35 of the 2013 Walgreens annual report below. You can navigate through the pages in the report by either clicking on the pages listed below, or by using the keyword search tool below to find specific information within the annual report.-
 1
1 -
2
-
3
-
4
-
5
-
6
-
7
-
8
-
9
-
10
-
11
-
12
-
13
-
14
-
15
-
16
-
17
-
18
-
19
-
20
-
21
-
22
-
23
-
24
-
 25
25 -
 26
26 -
 27
27 -
 28
28 -
 29
29 -
 30
30 -
 31
31 -
 32
32 -
 33
33 -
 34
34 -
 35
35 -
 36
36 -
 37
37 -
 38
38 -
 39
39 -
 40
40 -
 41
41 -
 42
42 -
 43
43 -
 44
44 -
 45
45 -
46
-
47
-
48
-
49
-
50
 |
 |
1. Summary of Major Accounting Policies
Description of Business
The Company is principally in the retail drugstore business and its operations are
within one reportable segment. At August 31, 2013, there were 8,582 drugstore
and other locations in all 50 states, the District of Columbia, Guam and Puerto Rico.
Prescription sales were 62.9% of total sales for fiscal 2013 compared to 63.2%
in 2012 and 64.7% in 2011.
Basis of Presentation
The consolidated financial statements include the accounts of the Company and its
subsidiaries. All intercompany transactions have been eliminated. The consolidated
financial statements are prepared in accordance with accounting principles
generally accepted in the United States of America and include amounts based
on management’s prudent judgments and estimates. Actual results may differ
from these estimates.
The Company’s 45% proportionate share of earnings in the Alliance Boots GmbH
(Alliance Boots) equity method investment is included in consolidated net earnings.
The Company reports its share of equity earnings in Alliance Boots within the
operating section in the Consolidated Statements of Comprehensive Income
because operations of Alliance Boots are integral to Walgreens. The companies
share common board of director members, recognize purchasing synergies through
Walgreens Boots Alliance Development GmbH, a 50/50 joint venture, as well as
engage in intercompany sales transactions on select front-end merchandise.
Because of the three-month lag and the timing of the closing of this investment,
only the ten months of August through May’s results of operations are reflected
in the equity earnings in Alliance Boots included in the Company’s reported net
earnings for year ended August 31, 2013.
The financial results of the Walgreens Boots Alliance Development GmbH joint
venture are fully consolidated into the Company’s consolidated financial statements
and reported without a lag. As the joint venture is included within the Company’s
operating results, Alliance Boots proportionate share of Walgreens Boots Alliance
Development GmbH earnings is removed from equity earnings.
Cash and Cash Equivalents
Cash and cash equivalents include cash on hand and all highly liquid investments
with an original maturity of three months or less. Credit and debit card receivables
from banks, which generally settle within two business days, of $160 million and
$88 million were included in cash and cash equivalents at August 31, 2013 and
2012, respectively. At August 31, 2013 and 2012, the Company had $1.6 billion
and $820 million, respectively, in money market funds, all of which was included
in cash and cash equivalents.
The Company’s cash management policy provides for controlled disbursement.
As a result, the Company had outstanding checks in excess of funds on deposit
at certain banks. These amounts, which were $274 million at August 31, 2013,
and $256 million at August 31, 2012, are included in trade accounts payable
in the accompanying Consolidated Balance Sheets.
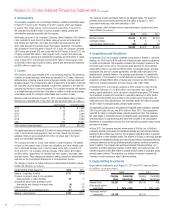
Allowance for Doubtful Accounts
The provision for bad debt is based on both historical write-off percentages and
specifically identified receivables. Activity in the allowance for doubtful accounts
was as follows (In millions):
2013 2012 2011
Balance at beginning of year $ 99 $ 101 $ 104
Bad debt provision 124 107 88
Write-offs (69) (109) (91)
Balance at end of year $ 154 $ 99 $ 101
Inventories
Inventories are valued on a lower of last-in, first-out (LIFO) cost or market basis.
At August 31, 2013 and 2012, inventories would have been greater by $2.1 billion
and $1.9 billion, respectively, if they had been valued on a lower of first-in,
first-out (FIFO) cost or market basis. As a result of declining inventory levels, the fiscal
2013 and 2012 LIFO provisions were reduced by $194 million and $268 million of LIFO
liquidation, respectively. Inventory includes product costs, inbound freight, warehousing
costs and vendor allowances not classified as a reduction of advertising expense.
Equity Method Investments
The Company uses the equity method to account for investments in companies if
the investment provides the ability to exercise significant influence, but not control,
over operating and financial policies of the investee. The Company’s proportionate
share of the net income or loss of these companies is included in consolidated net
earnings. Judgment regarding the level of influence over each equity method invest-
ment includes considering key factors such as the Company’s ownership interest,
representation on the board of directors, participation in policy-making decisions
and material intercompany transactions.
The Company purchases inventory from Alliance Boots in the ordinary course of
business. These related party inventory purchases, which began in fiscal 2013,
were not material.
The underlying net assets of the Company’s equity method investment in Alliance Boots
include goodwill and indefinite-lived intangible assets. These assets are evaluated for
impairment annually, or more frequently if an event occurs or circumstances change
that would more likely than not reduce the fair value of a reporting unit below its
carrying value. Based on testing performed during fiscal 2013, the fair value of each
Alliance Boots reporting unit exceeded its carrying value. For certain reporting units,
relatively modest changes in key assumptions may have resulted in the recognition
of a goodwill impairment charge. The Company’s proportionate share of a potential
impairment would be limited to its 45% ownership percentage.
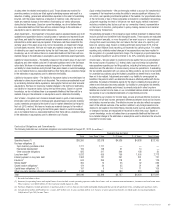
Property and Equipment
Depreciation is provided on a straight-line basis over the estimated useful lives of
owned assets. Leasehold improvements and leased properties under capital leases
are amortized over the estimated useful life of the property or over the term of the
lease, whichever is shorter. Estimated useful lives range from 10 to 39 years for
land improvements, buildings and building improvements; and 2 to 13 years for
equipment. Major repairs, which extend the useful life of an asset, are capitalized;
routine maintenance and repairs are charged against earnings. The majority of the
business uses the composite method of depreciation for equipment. Therefore,
gains and losses on retirement or other disposition of such assets are included
in earnings only when an operating location is closed, completely remodeled or
impaired. Fully depreciated property and equipment are removed from the cost
and related accumulated depreciation and amortization accounts. Property and
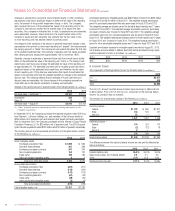
equipment consists of (In millions):
2013 2012
Land and land improvements
Owned locations $ 3,203 $ 3,189
Distribution centers 97 96
Other locations 219 232
Buildings and building improvements
Owned locations 3,805 3,684
Leased locations (leasehold improvements only) 1,811 1,518
Distribution centers 620 608
Other locations 351 525
Equipment
Locations 5,334 4,995
Distribution centers 1,190 1,158
Other locations 755 586
Capitalized system development costs 581 420
Capital lease properties 215 149
18,181 17,160
Less: accumulated depreciation and amortization 6,043 5,122
$ 12,138 $ 12,038
Depreciation expense for property and equipment was $894 million in fiscal 2013,
$841 million in fiscal 2012 and $809 million in fiscal 2011.
The Company capitalizes application stage development costs for significant internally
developed software projects, such as upgrades to the store point-of-sale system. These
costs are amortized over a five-year period. Amortization expense was $100 million in
fiscal 2013, $70 million in fiscal 2012 and $58 million in fiscal 2011. Unamortized
costs at August 31, 2013 and 2012, were $374 million and $292 million, respectively.
Notes to Consolidated Financial Statements
2013 Walgreens Annual Report 33