Walgreens 2013 Annual Report Download - page 39
Download and view the complete annual report
Please find page 39 of the 2013 Walgreens annual report below. You can navigate through the pages in the report by either clicking on the pages listed below, or by using the keyword search tool below to find specific information within the annual report.-
 1
1 -
2
-
3
-
4
-
5
-
6
-
7
-
8
-
9
-
10
-
11
-
12
-
13
-
14
-
15
-
16
-
17
-
18
-
19
-
20
-
21
-
22
-
23
-
24
-
25
-
26
-
27
-
28
-
 29
29 -
 30
30 -
 31
31 -
 32
32 -
 33
33 -
 34
34 -
 35
35 -
 36
36 -
 37
37 -
 38
38 -
 39
39 -
 40
40 -
 41
41 -
 42
42 -
 43
43 -
 44
44 -
 45
45 -
 46
46 -
 47
47 -
 48
48 -
 49
49 -
50
 |
 |

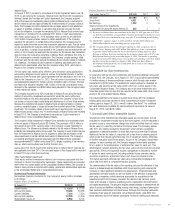
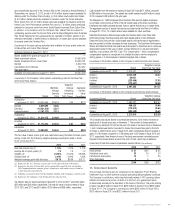
Income Statement (In millions)
Year Ended August 31, 2013 (3) 2012 2011
Net sales $ 30,466 $ 37 $ 37
Gross Profit 6,391 17 19
Net Earnings 1,022 2 5
Share of income from investments
accounted for using the equity method (3) 345 1 2
(1) Net assets in Alliance Boots are translated at the May 31, 2013 spot rate of $1.52 to
one British pound Sterling, corresponding to the three-month lag. Fiscal 2012 net assets
in Alliance Boots were translated at a spot rate of $1.57 to one British pound Sterling.
(2) Shareholders’ equity at August 31, 2013 and 2012, includes $374 million and
$380 million related to non-controlling interests, respectively.
(3) The Company utilizes a three-month lag in reporting its share of equity income in
Alliance Boots. Earnings reflect $57 million, $44 million net of tax, of incremental
acquisition-related amortization for the ten-month period ending August 31, 2013.
Earnings in Alliance Boots are translated at the average exchange rate of $1.57 to one
British pound Sterling for the year ended August 31, 2013. Ten months of operating
results are presented for Alliance Boots in fiscal 2013 corresponding to the three-month
lag after closing the investment on August 2, 2012. Walgreens Boots Alliance
Development GmbH operations are excluded from these results as the Company
consolidates the joint venture.
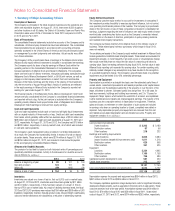
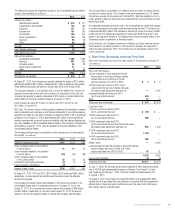
6. Available-for-Sale Investments
In conjunction with its long-term relationship with AmerisourceBergen announced
in fiscal 2013, the Company, as of August 31, 2013, has acquired approximately
4.0 million shares of AmerisourceBergen common stock through open market
transactions for $224 million. The available-for-sale investment is classified as
long-term and reported at fair value within other non-current assets in the
Consolidated Balance Sheets. The Company also holds other investments with
maturities greater than 90 days that are reported at fair value within other current
assets in the Consolidated Balance Sheets.
Fair value adjustments are based on quoted stock prices with the unrealized
holding gains and losses reported in other comprehensive income. Unrealized
holding gains at August 31, 2013, were $1 million. See Note 11 for additional
fair value disclosures. Available-for-sale investments reported at fair value at
August 31, 2013, were $225 million.
7. Goodwill and Other Intangible Assets
Goodwill and other indefinite-lived intangible assets are not amortized, but are
evaluated for impairment annually during the fourth quarter, or more frequently if
an event occurs or circumstances change that would more likely than not reduce
the fair value of a reporting unit below its carrying value. The Company applies
ASU 2011-08, Testing Goodwill for Impairment, which permits a qualitative
assessment to determine whether it is more likely than not (a more than 50 percent
likelihood) that the fair value of a reporting unit is less than its carrying amount,
which would then require performing step one of impairment testing. Otherwise,
no further evaluation would be necessary. As part of the Company’s impairment
analysis for each reporting unit, the Company engaged a third party appraisal
firm to assist in the determination of estimated fair value for each unit. This
determination included estimating the fair value using both the income and market
approaches. The income approach requires management to estimate a number
of factors for each reporting unit, including projected future operating results,
economic projections, anticipated future cash flows and discount rates.
The market approach estimates fair value using comparable marketplace fair
value data from within a comparable industry grouping.
The determination of the fair value of the reporting units and the allocation of that
value to individual assets and liabilities within those reporting units requires the
Company to make significant estimates and assumptions. These estimates and
assumptions primarily include, but are not limited to: the selection of appropriate
peer group companies; control premiums appropriate for acquisitions in the
industries in which the Company competes; the discount rate; terminal growth
rates; and forecasts of revenue, operating income, depreciation and amortization
and capital expenditures. The allocation requires several analyses to determine the fair
value of assets and liabilities including, among other things, purchased prescription
files, customer relationships and trade names. Although the Company believes its
estimates of fair value are reasonable, actual financial results could differ from
those estimates due to the inherent uncertainty involved in making such estimates.
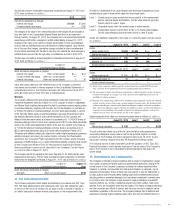
Alliance Boots
On August 2, 2012, pursuant to a Purchase and Option Agreement dated June 18,
2012, by and among the Company, Alliance Boots GmbH and AB Acquisitions
Holdings Limited (the Purchase and Option Agreement), the Company acquired
45% of the issued and outstanding share capital of Alliance Boots in exchange for
$4.025 billion in cash and approximately 83.4 million shares of Company common
stock. The Purchase and Option Agreement also provides, subject to the satisfaction
or waiver of specified conditions, a call option that gives the Company the right,
but not the obligation, to acquire the remaining 55% of Alliance Boots (second step
transaction) in exchange for an additional £3.1 billion in cash (approximately
$4.9 billion using August 31, 2013 exchange rates) as well as an additional
144.3 million Company shares, subject to certain adjustments. If the Company
exercises the call option, in certain limited circumstances, the Company may be
required to make the entire second step transaction payment in cash. The call option
can be exercised by the Company during the six-month period beginning February 2,
2015. In addition, in certain circumstances, if the Company does not exercise the call
option, or the Company has exercised the call option but the second step transaction
does not close, the Company’s ownership of Alliance Boots will reduce from 45% to
42% in exchange for nominal consideration. The Company’s equity earnings, initial
investment and the call option exclude the Alliance Boots minority interest in Galenica
Ltd. (Galenica). The Alliance Boots investment in Galenica was distributed to the
Alliance Boots shareholders other than the Company in May 2013, which had no
impact on the Company’s financial results.
The call option was valued using a Monte Carlo simulation using assumptions
surrounding Walgreens equity value as well as the potential impacts of certain
provisions of the Purchase and Option Agreement that are described in the Form 8-K
filed by the Company on June 19, 2012. The call option is accounted for at cost
and subsequently adjusted for foreign currency translation gains or losses. The final
purchase price allocation resulted in $6.1 billion of the total consideration being
allocated to the investment and $866 million being allocated to the call option based
on their relative fair values.
The Company accounts for its 45% investment in Alliance Boots using the equity
method of accounting. Investments accounted for under the equity method are
recorded initially at cost and subsequently adjusted for the Company’s share of the
net income or loss and cash contributions and distributions to or from these entities.
Because the underlying net assets in Alliance Boots are denominated in a foreign
currency, translation gains or losses will impact the recorded value of the Company’s
investment. The Company utilizes a three-month lag in reporting equity income in
Alliance Boots and as a result, only 10 months results of Alliance Boots were recorded
in fiscal 2013. The Company’s investment is recorded as “Equity investment in
Alliance Boots” in the Consolidated Balance Sheets.
The Company’s initial investment in Alliance Boots exceeded its proportionate share
of the net assets of Alliance Boots by $2.4 billion. This premium of $2.4 billion is
recognized as part of the carrying value in the Company’s equity investment in
Alliance Boots. The difference is primarily related to the fair value of Alliance Boots
indefinite-lived intangible assets and goodwill. The Company’s equity method income
from the investment in Alliance Boots is adjusted to reflect the amortization of fair
value adjustments in certain definite-lived assets of Alliance Boots. The Company’s
incremental amortization expense associated with the Alliance Boots investment
was approximately $57 million during fiscal 2013, largely consisting of the inventory
step-up, which was amortized over the first inventory turn.
During July 2013, the UK Government enacted a law to reduce the UK corporate tax
rate applicable from April 2014. The non-cash impact of this change will be recorded
in fiscal 2014 due to the three-month lag.
Other Equity Method Investments
Other equity method investments relate to joint ventures associated with the
Company’s infusion and respiratory businesses. These investments are included
within other non-current assets on the Consolidated Balance Sheets. The Company’s
share of equity income is reported within selling, general and administrative expenses
in the Consolidated Statements of Comprehensive Income.
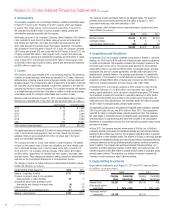
Summarized Financial Information
Summarized financial information for the Company’s equity method investees
is as follows:
Balance Sheet (In millions)
At August 31, 2013 (1) 2012 (1)
Current Assets $ 8,906 $ 9,193
Non-Current Assets 19,484 20,085
Current Liabilities 7,204 7,254
Non-Current Liabilities 12,228 13,269
Shareholders’ Equity (2) 8,958 8,755
2013 Walgreens Annual Report 37