Yahoo 2008 Annual Report Download - page 85
Download and view the complete annual report
Please find page 85 of the 2008 Yahoo annual report below. You can navigate through the pages in the report by either clicking on the pages listed below, or by using the keyword search tool below to find specific information within the annual report.-
 1
1 -
2
-
3
-
4
-
5
-
6
-
7
-
8
-
9
-
10
-
11
-
12
-
13
-
14
-
15
-
16
-
17
-
18
-
19
-
20
-
21
-
22
-
23
-
24
-
25
-
26
-
27
-
28
-
29
-
30
-
31
-
32
-
33
-
34
-
35
-
36
-
37
-
38
-
39
-
40
-
41
-
42
-
43
-
44
-
45
-
46
-
47
-
48
-
49
-
50
-
51
-
52
-
53
-
54
-
55
-
56
-
57
-
58
-
59
-
60
-
61
-
62
-
63
-
64
-
65
-
66
-
67
-
68
-
69
-
70
-
71
-
72
-
73
-
74
-
 75
75 -
 76
76 -
 77
77 -
 78
78 -
 79
79 -
 80
80 -
 81
81 -
 82
82 -
 83
83 -
 84
84 -
 85
85 -
 86
86 -
 87
87 -
 88
88 -
 89
89 -
 90
90 -
 91
91 -
 92
92 -
 93
93 -
 94
94 -
 95
95 -
96
-
97
-
98
-
99
-
100
-
101
-
102
-
103
-
104
-
105
-
106
-
107
-
108
-
109
-
110
-
111
-
112
-
113
-
114
-
115
-
116
-
117
-
118
-
119
-
120
-
121
-
122
-
123
-
124
-
125
-
126
-
127
-
128
-
129
-
130
-
131
-
132
 |
 |

Yahoo! Inc.
Notes to Consolidated Financial Statements—(Continued)
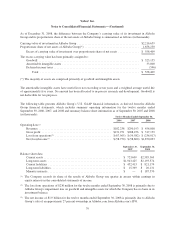
As of December 31, 2008, the difference between the Company’s carrying value of its investment in Alibaba
Group and its proportionate share of the net assets of Alibaba Group is summarized as follows (in thousands):
Carrying value of investment in Alibaba Group .......................................... $2,216,659
Proportionate share of net assets of Alibaba Group(*) ..................................... 1,658,250
Excess of carrying value of investment over proportionate share of net assets .............. $ 558,409
The excess carrying value has been primarily assigned to:
Goodwill .................................................................... $ 525,155
Amortizable intangible assets .................................................... 33,800
Deferred income taxes .......................................................... (546)
Total ................................................................... $ 558,409
(*) The majority of assets are comprised primarily of goodwill and intangible assets.
The amortizable intangible assets have useful lives not exceeding seven years and a weighted average useful life
of approximately five years. No amount has been allocated to in-process research and development. Goodwill is
not deductible for tax purposes.
The following table presents Alibaba Group’s U.S. GAAP financial information, as derived from the Alibaba
Group financial statements, which includes summary operating information for the twelve months ended
September 30, 2006, 2007, and 2008 and summary balance sheet information as of September 30, 2007 and 2008
(in thousands): Twelve Months Ended September 30,
2006 2007 2008
Operating data:(1)
Revenues ................................................. $182,238 $290,193 $ 456,808
Gross profit ............................................... $131,971 $208,476 $ 317,139
Loss from operations(2) ...................................... $(67,565) $ (59,582) $ (236,017)
Net (loss)/income(3) ......................................... $(58,750) $ (58,860) $1,870,093
September 30,
2007
September 30,
2008
Balance sheet data:
Current assets .................................................... $ 723,609 $2,585,369
Long-term assets ................................................. $1,943,425 $2,193,374
Current liabilities ................................................. $ 452,413 $ 821,174
Long-term liabilities ............................................... $ 15,369 $ 20,131
Minority interests ................................................. $ — $ 187,570
(1) The Company records its share of the results of Alibaba Group one quarter in arrears within earnings in
equity interests in the consolidated statements of income.
(2) The loss from operations of $236 million for the twelve months ended September 30, 2008 is primarily due to
Alibaba Group’s impairment loss on goodwill and intangible assets for which the Company has no basis in its
investment balance.
(3) The net income of $1.9 billion for the twelve months ended September 30, 2008 is primarily due to Alibaba
Group’s sale of an approximate 27 percent ownership in Alibaba.com from Alibaba.com’s IPO.
79