Yahoo 2008 Annual Report Download - page 92
Download and view the complete annual report
Please find page 92 of the 2008 Yahoo annual report below. You can navigate through the pages in the report by either clicking on the pages listed below, or by using the keyword search tool below to find specific information within the annual report.-
 1
1 -
2
-
3
-
4
-
5
-
6
-
7
-
8
-
9
-
10
-
11
-
12
-
13
-
14
-
15
-
16
-
17
-
18
-
19
-
20
-
21
-
22
-
23
-
24
-
25
-
26
-
27
-
28
-
29
-
30
-
31
-
32
-
33
-
34
-
35
-
36
-
37
-
38
-
39
-
40
-
41
-
42
-
43
-
44
-
45
-
46
-
47
-
48
-
49
-
50
-
51
-
52
-
53
-
54
-
55
-
56
-
57
-
58
-
59
-
60
-
61
-
62
-
63
-
64
-
65
-
66
-
67
-
68
-
69
-
70
-
71
-
72
-
73
-
74
-
75
-
76
-
77
-
78
-
79
-
80
-
81
-
 82
82 -
 83
83 -
 84
84 -
 85
85 -
 86
86 -
 87
87 -
 88
88 -
 89
89 -
 90
90 -
 91
91 -
 92
92 -
 93
93 -
 94
94 -
 95
95 -
 96
96 -
 97
97 -
 98
98 -
 99
99 -
 100
100 -
 101
101 -
 102
102 -
103
-
104
-
105
-
106
-
107
-
108
-
109
-
110
-
111
-
112
-
113
-
114
-
115
-
116
-
117
-
118
-
119
-
120
-
121
-
122
-
123
-
124
-
125
-
126
-
127
-
128
-
129
-
130
-
131
-
132
 |
 |

Yahoo! Inc.
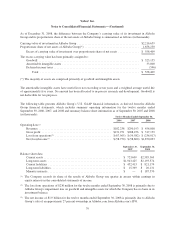
Notes to Consolidated Financial Statements—(Continued)
December 31, 2008
Gross
Amortized
Costs
Gross
Unrealized
Gains
Gross
Unrealized
Losses
Estimated
Fair Value
U.S. Government and agency securities .................. $ 935,025 $ 1,602 $ — $ 936,627
Municipal bonds .................................... 47,687 55 — 47,742
Corporate debt securities .............................. 247,554 739 (2,985) 245,308
Corporate equity securities(*) .......................... 68,745 17,884 — 86,629
Total investments in available-for-sale securities ....... $1,299,011 $20,280 $(2,985) $1,316,306
December 31,
2007 2008
Reported as:
Short-term marketable debt securities .................................... $487,544 $1,159,691
Long-term marketable debt securities .................................... 361,998 69,986
Other assets(*) ...................................................... 125,913 86,629
Total .......................................................... $975,455 $1,316,306
Available-for-sale securities included in cash and cash equivalents on the consolidated balance sheets are not
included in the table above as the gross unrealized gains and losses were immaterial for 2007 and 2008 with
respect to these securities.
(*) These balances include the Company’s cost method investment in Gmarket, which is included in other long-
term assets in the consolidated balance sheets.
The contractual maturities of available-for-sale marketable debt securities were as follows (in thousands):
December 31,
2007 2008
Due within one year ...................................................... $487,544 $1,159,691
Due after one year through five years ........................................ 361,998 69,986
Total available-for-sale marketable debt securities .......................... $849,542 $1,229,677
The following tables show all investments in an unrealized loss position for which an other-than-temporary
impairment has not been recognized and the related gross unrealized losses and fair value, aggregated by
investment category and length of time that individual securities have been in a continuous unrealized loss
position (in thousands):
December 31, 2007
Less than 12 Months 12 Months or Greater Total
Fair
Value
Unrealized
Loss
Fair
Value
Unrealized
Loss
Fair
Value
Unrealized
Loss
U.S. Government and agency securities . . $ 1,993 $ (19) $ 66,655 $ (220) $ 68,648 $ (239)
Corporate debt securities .............. 113,328 (646) 237,581 (925) 350,909 (1,571)
Corporate equity securities ............ 867 (1,125) — — 867 (1,125)
Total investments in
available-for-sale securities ...... $116,188 $(1,790) $304,236 $(1,145) $420,424 $(2,935)
86