Yahoo 2008 Annual Report Download - page 90
Download and view the complete annual report
Please find page 90 of the 2008 Yahoo annual report below. You can navigate through the pages in the report by either clicking on the pages listed below, or by using the keyword search tool below to find specific information within the annual report.-
 1
1 -
2
-
3
-
4
-
5
-
6
-
7
-
8
-
9
-
10
-
11
-
12
-
13
-
14
-
15
-
16
-
17
-
18
-
19
-
20
-
21
-
22
-
23
-
24
-
25
-
26
-
27
-
28
-
29
-
30
-
31
-
32
-
33
-
34
-
35
-
36
-
37
-
38
-
39
-
40
-
41
-
42
-
43
-
44
-
45
-
46
-
47
-
48
-
49
-
50
-
51
-
52
-
53
-
54
-
55
-
56
-
57
-
58
-
59
-
60
-
61
-
62
-
63
-
64
-
65
-
66
-
67
-
68
-
69
-
70
-
71
-
72
-
73
-
74
-
75
-
76
-
77
-
78
-
79
-
 80
80 -
 81
81 -
 82
82 -
 83
83 -
 84
84 -
 85
85 -
 86
86 -
 87
87 -
 88
88 -
 89
89 -
 90
90 -
 91
91 -
 92
92 -
 93
93 -
 94
94 -
 95
95 -
 96
96 -
 97
97 -
 98
98 -
 99
99 -
 100
100 -
101
-
102
-
103
-
104
-
105
-
106
-
107
-
108
-
109
-
110
-
111
-
112
-
113
-
114
-
115
-
116
-
117
-
118
-
119
-
120
-
121
-
122
-
123
-
124
-
125
-
126
-
127
-
128
-
129
-
130
-
131
-
132
 |
 |

Yahoo! Inc.
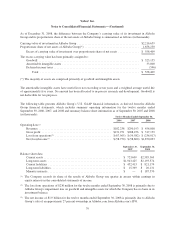
Notes to Consolidated Financial Statements—(Continued)
Other consists mainly of foreign exchange gains and losses due to re-measurement of assets and liabilities
denominated in non-functional currencies.
Prepaid expenses and other current assets
As of December 31, Prepaid expenses and other current assets consisted of the following (in thousands):
2007 2008
Prepaid expenses ....................................................... $ 69,498 $ 70,084
Deferred income taxes (Note 10) .......................................... 83,691 143,131
Other ................................................................ 27,527 19,846
Total prepaid expenses and other current assets ........................... $ 180,716 $ 233,061
Property and equipment, net
As of December 31, Property and equipment, net consisted of the following (in thousands):
2007 2008
Land ................................................................. $ 163,068 $ 170,949
Buildings ............................................................. 238,035 256,131
Leasehold improvements ................................................. 173,847 220,305
Computers and equipment(*) ............................................. 1,173,737 1,384,000
Furniture and fixtures ................................................... 70,205 67,886
Assets not yet in use .................................................... 119,690 206,216
1,938,582 2,305,487
Less: accumulated depreciation and amortization ............................. (606,950) (769,306)
Total property and equipment, net ..................................... $1,331,632 $1,536,181
(*) Includes data center equipment acquired in 2008 under a capital lease of approximately $43 million.
Other long-term assets
As of December 31, Other long-term assets consisted of the following (in thousands):
2007 2008
Deferred income taxes (Note 10) .......................................... $ 299,923 $ 36,821
Investments in privately-held companies .................................... 17,835 38,428
Investments in publicly-held companies ..................................... 125,913 86,629
Other ................................................................ 60,274 72,111
Total other long-term assets .......................................... $ 503,945 $ 233,989
84