Yahoo 2008 Annual Report Download - page 91
Download and view the complete annual report
Please find page 91 of the 2008 Yahoo annual report below. You can navigate through the pages in the report by either clicking on the pages listed below, or by using the keyword search tool below to find specific information within the annual report.-
 1
1 -
2
-
3
-
4
-
5
-
6
-
7
-
8
-
9
-
10
-
11
-
12
-
13
-
14
-
15
-
16
-
17
-
18
-
19
-
20
-
21
-
22
-
23
-
24
-
25
-
26
-
27
-
28
-
29
-
30
-
31
-
32
-
33
-
34
-
35
-
36
-
37
-
38
-
39
-
40
-
41
-
42
-
43
-
44
-
45
-
46
-
47
-
48
-
49
-
50
-
51
-
52
-
53
-
54
-
55
-
56
-
57
-
58
-
59
-
60
-
61
-
62
-
63
-
64
-
65
-
66
-
67
-
68
-
69
-
70
-
71
-
72
-
73
-
74
-
75
-
76
-
77
-
78
-
79
-
80
-
 81
81 -
 82
82 -
 83
83 -
 84
84 -
 85
85 -
 86
86 -
 87
87 -
 88
88 -
 89
89 -
 90
90 -
 91
91 -
 92
92 -
 93
93 -
 94
94 -
 95
95 -
 96
96 -
 97
97 -
 98
98 -
 99
99 -
 100
100 -
 101
101 -
102
-
103
-
104
-
105
-
106
-
107
-
108
-
109
-
110
-
111
-
112
-
113
-
114
-
115
-
116
-
117
-
118
-
119
-
120
-
121
-
122
-
123
-
124
-
125
-
126
-
127
-
128
-
129
-
130
-
131
-
132
 |
 |

Yahoo! Inc.
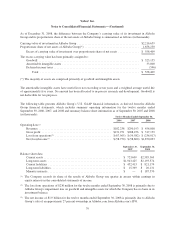
Notes to Consolidated Financial Statements—(Continued)
Accrued expenses and other current liabilities
As of December 31, Accrued expenses and other current liabilities consisted of the following (in thousands):
2007 2008
Accrued content, connection, traffic acquisition, and other costs .................. $ 331,378 $ 374,920
Deferred income taxes (Note 10) .......................................... 13,105 865
Accrued compensation and related expenses ................................. 338,490 318,958
Accrued taxes payable ................................................... 39,120 23,194
Accrued professional service expenses ...................................... 73,115 77,032
Accrued sales and marketing related expenses ................................ 54,347 44,335
Accrued restructuring and acquisition-related costs ............................ 16,466 82,268
Other ................................................................ 140,167 218,322
Total accrued expenses and other current liabilities ........................ $1,006,188 $1,139,894
Deferred and other long-term tax liabilities, net
As of December 31, Deferred and other long-term tax liabilities, net consisted of the following (in thousands):
2007 2008
Deferred income taxes ...................................................... $ 15,684 $ 68,097
Tax contingency accruals(*) ................................................. 245,309 352,275
Total deferred and other long-term tax liabilities, net (Note 10) ................. $260,993 $420,372
(*) Includes interest and penalties.
Accumulated other comprehensive income
As of December 31, the components of Accumulated other comprehensive income were as follows (in
thousands):
2007 2008
Unrealized gains and losses on available-for-sale securities, net of tax ................ $ 26,874 $ 6,857
Foreign currency translation, net of tax ........................................ 304,328 113,419
Accumulated other comprehensive income ................................. $331,202 $120,276
Note 8 I
NVESTMENTS
The following tables summarize the investments in available-for-sale securities (in thousands):
December 31, 2007
Gross
Amortized
Costs
Gross
Unrealized
Gains
Gross
Unrealized
Losses
Estimated
Fair Value
U.S. Government and agency securities ..................... $219,681 $ 1,648 $ (239) $221,090
Municipal bonds ....................................... 4,634 44 — 4,678
Corporate debt securities ................................. 623,212 2,133 (1,571) 623,774
Corporate equity securities(*) ............................. 71,178 55,860 (1,125) 125,913
Total investments in available-for-sale securities .......... $918,705 $59,685 $(2,935) $975,455
85