Yahoo 2008 Annual Report Download - page 89
Download and view the complete annual report
Please find page 89 of the 2008 Yahoo annual report below. You can navigate through the pages in the report by either clicking on the pages listed below, or by using the keyword search tool below to find specific information within the annual report.-
 1
1 -
2
-
3
-
4
-
5
-
6
-
7
-
8
-
9
-
10
-
11
-
12
-
13
-
14
-
15
-
16
-
17
-
18
-
19
-
20
-
21
-
22
-
23
-
24
-
25
-
26
-
27
-
28
-
29
-
30
-
31
-
32
-
33
-
34
-
35
-
36
-
37
-
38
-
39
-
40
-
41
-
42
-
43
-
44
-
45
-
46
-
47
-
48
-
49
-
50
-
51
-
52
-
53
-
54
-
55
-
56
-
57
-
58
-
59
-
60
-
61
-
62
-
63
-
64
-
65
-
66
-
67
-
68
-
69
-
70
-
71
-
72
-
73
-
74
-
75
-
76
-
77
-
78
-
 79
79 -
 80
80 -
 81
81 -
 82
82 -
 83
83 -
 84
84 -
 85
85 -
 86
86 -
 87
87 -
 88
88 -
 89
89 -
 90
90 -
 91
91 -
 92
92 -
 93
93 -
 94
94 -
 95
95 -
 96
96 -
 97
97 -
 98
98 -
 99
99 -
100
-
101
-
102
-
103
-
104
-
105
-
106
-
107
-
108
-
109
-
110
-
111
-
112
-
113
-
114
-
115
-
116
-
117
-
118
-
119
-
120
-
121
-
122
-
123
-
124
-
125
-
126
-
127
-
128
-
129
-
130
-
131
-
132
 |
 |

Yahoo! Inc.
Notes to Consolidated Financial Statements—(Continued)
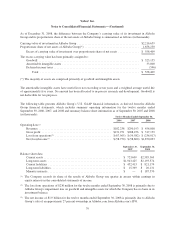
(1) Foreign currency translation adjustments, reflecting movement in the currencies of the underlying entities,
totaled approximately $26 million as of December 31, 2007 and $11 million as of December 31, 2008.
(2) As of December 31, 2007 and 2008, $506 million and $413 million, respectively, of the net intangibles
balance were related to the U.S. segment. As of December 31, 2007 and 2008, $105 million and $73 million,
respectively, of the net intangibles balance were related to the International segment.
The intangible assets have original estimated useful lives as follows:
• Customer, affiliate, and advertiser related relationships—three to eight years;
• Developed technology and patents—less than one year to eight years; and
• Trademark, trade name, and domain name—one year to indefinite lived.
The Company recognized amortization expense of intangible assets of approximately $238 million, $250 million,
and $281 million for 2006, 2007, and 2008, respectively, including $113 million, $143 million, and $194 million,
respectively, included in cost of revenues. Based on the current amount of intangibles subject to amortization, the
estimated amortization expense for each of the succeeding years is as follows: 2009: $166 million; 2010: $138
million; 2011: $89 million; 2012: $57 million; 2013: $21 million; 2014: $10 million; and cumulatively thereafter:
$5 million.
Note 7 C
ONSOLIDATED
F
INANCIAL
S
TATEMENT
D
ETAILS
Other income, net
Other income, net for 2006, 2007, and 2008 were as follows (in thousands):
Years Ended December 31,
2006 2007 2008
Interest and investment income ................................... $143,310 $ 129,541 $ 86,056
Investment gains, net ........................................... (3,527) 1,730 (351)
Gain on divestiture of Yahoo! China(*) ............................. 15,158 8,066 —
Gain on sale of Overture Japan(*) ................................. — 6,175 —
Gain on sale of Kelkoo SAS ..................................... — — 25,149
Other ........................................................ 2,093 8,499 (28,016)
Total other income, net ..................................... $157,034 $ 154,011 $ 82,838
(*) See Note 4—“Investments in Equity Interests” for additional information related to the gains on the
divestiture of Yahoo! China and sale of Overture Japan.
Interest and investment income consist of income earned from cash in bank accounts and investments made in
marketable debt securities and money market funds.
Investment gains (losses), net includes realized gains and losses related to sales of marketable debt securities and/
or investments in publicly traded or privately held companies as well as any declines in the values of such
investments judged to be other-than-temporary.
During the year ended December 31, 2008, the Company completed the sale of Kelkoo SAS and recorded a
pre-tax gain of approximately $25 million in other income, net. The transaction was accounted for as a sale of a
business.
83