Yahoo 2012 Annual Report Download - page 100
Download and view the complete annual report
Please find page 100 of the 2012 Yahoo annual report below. You can navigate through the pages in the report by either clicking on the pages listed below, or by using the keyword search tool below to find specific information within the annual report.-
 1
1 -
2
-
3
-
4
-
5
-
6
-
7
-
8
-
9
-
10
-
11
-
12
-
13
-
14
-
15
-
16
-
17
-
18
-
19
-
20
-
21
-
22
-
23
-
24
-
25
-
26
-
27
-
28
-
29
-
30
-
31
-
32
-
33
-
34
-
35
-
36
-
37
-
38
-
39
-
40
-
41
-
42
-
43
-
44
-
45
-
46
-
47
-
48
-
49
-
50
-
51
-
52
-
53
-
54
-
55
-
56
-
57
-
58
-
59
-
60
-
61
-
62
-
63
-
64
-
65
-
66
-
67
-
68
-
69
-
70
-
71
-
72
-
73
-
74
-
75
-
76
-
77
-
78
-
79
-
80
-
81
-
82
-
83
-
84
-
85
-
86
-
87
-
88
-
89
-
 90
90 -
 91
91 -
 92
92 -
 93
93 -
 94
94 -
 95
95 -
 96
96 -
 97
97 -
 98
98 -
 99
99 -
 100
100 -
 101
101 -
 102
102 -
 103
103 -
 104
104 -
 105
105 -
 106
106 -
 107
107 -
 108
108 -
 109
109 -
 110
110 -
111
-
112
-
113
-
114
-
115
-
116
-
117
-
118
-
119
-
120
-
121
-
122
-
123
-
124
-
125
-
126
-
127
-
128
-
129
-
130
-
131
-
132
-
133
-
134
-
135
-
136
-
137
-
138
-
139
-
140
-
141
-
142
-
143
-
144
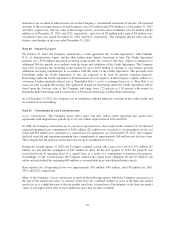
 |
 |

December 31, 2012
Gross Carrying
Amount
Accumulated
Amortization(*) Net
Customer, affiliate, and advertiser related relationships ........... $162,389 $ (99,996) $ 62,393
Developed technology and patents ........................... 270,485 (198,851) 71,634
Trade names, trademarks, and domain names ................... 50,382 (30,436) 19,946
Total intangible assets, net .............................. $483,256 $(329,283) $153,973
(*) Cumulative foreign currency translation adjustments, reflecting movement in the currencies of the underlying
entities, increased total intangible assets by approximately $18 million and $19 million as of December 31,
2011 and 2012, respectively.
The intangible assets have estimated useful lives as follows:
• Customer, affiliate, and advertiser related relationships—two to eight years;
• Developed technology and patents—one year to eight years; and
• Trade names, trademarks, and domain names—one year to an indefinite life.
The Company recognized amortization expense of intangible assets of approximately $127 million, $118 million,
and $105 million for 2010, 2011, and 2012, respectively, including $96 million, $84 million, and $70 million,
respectively, included in cost of revenue-other. Based on the current amount of intangibles subject to
amortization, the estimated amortization expense for each of the succeeding years is as follows: 2013: $62
million; 2014: $42 million; 2015: $22 million; 2016: $7 million; and 2017: $5 million.
Note 7 B
ASIC
A
ND
D
ILUTED
N
ET
I
NCOME
A
TTRIBUTABLE
T
O
Y
AHOO
!C
OMMON
S
TOCKHOLDERS
P
ER
S
HARE
Basic and diluted net income attributable to Yahoo! common stockholders per share is computed using the
weighted average number of common shares outstanding during the period, excluding net income attributable to
participating securities (restricted stock awards granted under the Company’s 1995 Stock Plan and restricted
stock units granted under the Company’s 1996 Directors’ Stock Plan (the “Directors’ Plan”)). Diluted net income
per share is computed using the weighted average number of common shares and, if dilutive, potential common
shares outstanding during the period. Potential common shares are calculated using the treasury stock method
and consist of unvested restricted stock and shares underlying unvested restricted stock units, the incremental
common shares issuable upon the exercise of stock options, and shares to be purchased under the Company’s
1996 Employee Stock Purchase Plan (the “Employee Stock Purchase Plan”). The Company calculates potential
tax windfalls and shortfalls by including the impact of pro forma deferred tax assets.
The Company takes into account the effect on consolidated net income per share of dilutive securities of entities
in which the Company holds equity interests that are accounted for using the equity method.
For 2010, 2011, and 2012, potentially dilutive securities representing approximately 80 million, 56 million, and
39 million shares of common stock, respectively, were excluded from the computation of diluted earnings per
share for these periods because their effect would have been anti-dilutive.
86