Yahoo 2012 Annual Report Download - page 113
Download and view the complete annual report
Please find page 113 of the 2012 Yahoo annual report below. You can navigate through the pages in the report by either clicking on the pages listed below, or by using the keyword search tool below to find specific information within the annual report.-
 1
1 -
2
-
3
-
4
-
5
-
6
-
7
-
8
-
9
-
10
-
11
-
12
-
13
-
14
-
15
-
16
-
17
-
18
-
19
-
20
-
21
-
22
-
23
-
24
-
25
-
26
-
27
-
28
-
29
-
30
-
31
-
32
-
33
-
34
-
35
-
36
-
37
-
38
-
39
-
40
-
41
-
42
-
43
-
44
-
45
-
46
-
47
-
48
-
49
-
50
-
51
-
52
-
53
-
54
-
55
-
56
-
57
-
58
-
59
-
60
-
61
-
62
-
63
-
64
-
65
-
66
-
67
-
68
-
69
-
70
-
71
-
72
-
73
-
74
-
75
-
76
-
77
-
78
-
79
-
80
-
81
-
82
-
83
-
84
-
85
-
86
-
87
-
88
-
89
-
90
-
91
-
92
-
93
-
94
-
95
-
96
-
97
-
98
-
99
-
100
-
101
-
102
-
 103
103 -
 104
104 -
 105
105 -
 106
106 -
 107
107 -
 108
108 -
 109
109 -
 110
110 -
 111
111 -
 112
112 -
 113
113 -
 114
114 -
 115
115 -
 116
116 -
 117
117 -
 118
118 -
 119
119 -
 120
120 -
 121
121 -
 122
122 -
 123
123 -
124
-
125
-
126
-
127
-
128
-
129
-
130
-
131
-
132
-
133
-
134
-
135
-
136
-
137
-
138
-
139
-
140
-
141
-
142
-
143
-
144
 |
 |

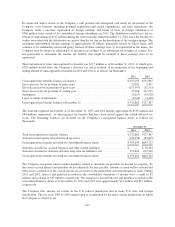
The weighted average grant date fair value of options granted in the years ended December 31, 2010, 2011, and
2012 was $5.27, $5.04, and $4.36 per share, respectively.
The aggregate intrinsic value in the table above represents the total pre-tax intrinsic value (the aggregate
difference between the closing stock price of the Company’s common stock on December 31, 2012 and the
exercise price for in-the-money options) that would have been received by the option holders if all in-the-money
options had been exercised on December 31, 2012.
The total intrinsic value of options exercised in the years ended December 31, 2010, 2011, and 2012 was $49
million, $46 million, and $45 million, respectively.
As of December 31, 2012, there was $30 million of unamortized stock-based compensation expense related to
unvested stock options, which is expected to be recognized over a weighted average period of 1.5 years.
Cash received from option exercises and purchases of shares under the Employee Stock Purchase Plan for the
year ended December 31, 2012 was $218 million.
The total net tax benefit attributable to stock options exercised in the year ended December 31, 2012 was $14 million.
The fair value of option grants is determined using the Black-Scholes option pricing model with the following
weighted average assumptions:
Stock Options Purchase Plans(5)
Years Ended December 31, Years Ended December 31,
2010 2011 2012 2010 2011 2012
Expected dividend yield(1) ........................... 0.0% 0.0% 0.0% 0.0% 0.0% 0.0%
Risk-free interest rate(2) ............................. 1.6% 1.3% 0.6% 1.2% 0.4% 0.4%
Expected volatility(3) ............................... 34.7% 36.9% 31.9% 60.5% 35.6% 33.7%
Expected life (in years)(4) ........................... 4.06 4.03 4.02 0.55 1.04 1.21
(1) The Company currently has no history or expectation of paying cash dividends on its common stock in the
near future.
(2) The risk-free interest rate is based on the U.S. Treasury yield for a term consistent with the expected term of
the awards in effect at the time of grant.
(3) The Company estimates the volatility of its common stock at the date of grant based on the implied volatility
of publicly traded options on its common stock, with a term of one year or greater.
(4) The expected life of stock options granted under the Plans is based on historical exercise patterns, which the
Company believes are representative of future behavior. New grants issued by the Company had an expected
life of 4.5 years in 2010, 4.25 years in 2011, and 4.00 years in 2012. Options assumed in acquisitions had
expected lives of less than 4 years.
(5) Assumptions for the Employee Stock Purchase Plan relate to the annual average of the enrollment periods.
During the year ended December 31, 2012, enrollment was permitted in May and November of each year.
Beginning in 2013, enrollment will be permitted in February, May, August, and November of each year.
Restricted stock awards activity for the year ended December 31, 2012 is summarized as follows (in thousands,
except per share amounts):
Shares
Weighted Average
Grant Date Fair Value
Awarded and unvested at December 31, 2011 ............................ 38,775 $17.28
Granted .......................................................... 25,023 $15.67
Assumed ......................................................... 351 $16.61
Vested ........................................................... (10,715) $15.96
Forfeited ......................................................... (19,633) $15.35
Awarded and unvested at December 31, 2012 ........................ 33,801 $17.63
99