McKesson 2005 Annual Report Download - page 30
Download and view the complete annual report
Please find page 30 of the 2005 McKesson annual report below. You can navigate through the pages in the report by either clicking on the pages listed below, or by using the keyword search tool below to find specific information within the annual report.-
 1
1 -
2
-
3
-
4
-
5
-
6
-
7
-
8
-
9
-
10
-
11
-
12
-
13
-
14
-
15
-
16
-
17
-
18
-
19
-
 20
20 -
 21
21 -
 22
22 -
 23
23 -
 24
24 -
 25
25 -
 26
26 -
 27
27 -
 28
28 -
 29
29 -
 30
30 -
 31
31 -
 32
32 -
 33
33 -
 34
34 -
 35
35 -
 36
36 -
 37
37 -
 38
38 -
 39
39 -
 40
40 -
41
-
42
-
43
-
44
-
45
-
46
-
47
-
48
-
49
-
50
-
51
-
52
-
53
-
54
-
55
-
56
-
57
-
58
-
59
-
60
-
61
-
62
-
63
-
64
-
65
-
66
-
67
-
68
-
69
-
70
-
71
-
72
-
73
-
74
-
75
-
76
-
77
-
78
-
79
-
80
-
81
-
82
-
83
-
84
-
85
-
86
-
87
-
88
-
89
-
90
-
91
-
92
-
93
-
94
-
95
-
96
-
97
-
98
-
99
-
100
-
101
-
102
-
103
-
104
-
105
-
106
-
107
-
108
-
109
-
110
-
111
-
112
-
113
-
114
-
115
-
116
-
117
-
118
-
119
-
120
-
121
-
122
-
123
-
124
-
125
-
126
-
127
-
128
-
129
-
130
-
131
-
132
-
133
-
134
-
135
-
136
-
137
-
138
-
139
-
140
-
141
-
142
-
143
-
144
-
145
-
146
-
147
-
148
-
149
-
150
-
151
-
152
-
153
-
154
-
155
-
156
-
157
-
158
-
159
-
160
-
161
-
162
-
163
-
164
-
165
-
166
-
167
-
168
-
169
-
170
-
171
-
172
-
173
-
174
-
175
-
176
-
177
-
178
-
179
-
180
-
181
-
182
-
183
-
184
-
185
-
186
-
187
-
188
-
189
-
190
-
191
-
192
-
193
-
194
-
195
-
196
-
197
-
198
-
199
-
200
-
201
-
202
-
203
-
204
-
205
-
206
-
207
-
208
-
209
-
210
-
211
-
212
-
213
-
214
-
215
-
216
-
217
-
218
-
219
-
220
-
221
-
222
-
223
-
224
-
225
-
226
-
227
-
228
-
229
-
230
-
231
-
232
-
233
-
234
-
235
-
236
-
237
-
238
-
239
-
240
-
241
-
242
-
243
-
244
-
245
-
246
-
247
-
248
-
249
-
250
-
251
-
252
-
253
-
254
-
255
-
256
-
257
-
258
-
259
-
260
-
261
-
262
-
263
-
264
-
265
-
266
-
267
-
268
-
269
-
270
-
271
-
272
-
273
-
274
-
275
-
276
-
277
-
278
-
279
-
280
-
281
-
282
-
283
-
284
-
285
-
286
-
287
-
288
-
289
-
290
-
291
-
292
-
293
-
294
-
295
-
296
-
297
-
298
-
299
-
300
-
301
-
302
-
303
-
304
-
305
-
306
-
307
-
308
-
309
-
310
-
311
-
312
-
313
-
314
-
315
-
316
-
317
-
318
-
319
-
320
-
321
-
322
-
323
-
324
-
325
-
326
-
327
-
328
-
329
-
330
-
331
-
332
-
333
-
334
-
335
-
336
-
337
-
338
-
339
-
340
 |
 |

McKESSON CORPORATION
FINANCIAL REVIEW (Continued)
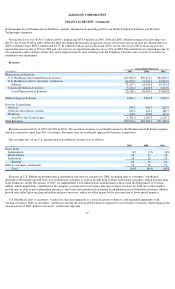
provide us with price protection, which prevents inventory losses. Price declines on many generic pharmaceutical products in this segment over
the last few years have moderated the effects of inflation in other product categories, which resulted in minimal overall price changes in those
fiscal years.
Over the past two years, gross profit margin increased in our Medical-Surgical Solutions segment primarily due to a higher proportion of
revenues being derived from our alternative site sector, which includes MMC, which has higher margins relative to the segment’s other sectors.
Gross profit margin decreased in 2005 and increased in 2004 in our Provider Technologies segment. Excluding a $51.0 million provision for
expected losses on certain of the segment’s international contracts in 2003, gross profit margin for 2004 approximated that of 2003. The
decrease in the segment’s gross profit margin in 2005 primarily reflects a greater mix of revenue associated with clinical products which,
because of their complexity, have a higher cost of installation and support than other more established products.
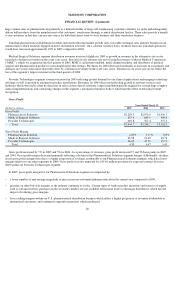
In addition, in 2003, our Provider Technologies segment recorded a $51.0 million provision for expected losses on five multi-year contracts
in the segment’s international business. Substantially all of these expected losses pertain to contracts that were entered into in 2001 or earlier.
These contracts contained multiple-element deliverables, including customization of software. In addition, these contracts place significant
reliance on third party vendors, as well as the customers. During the software development and implementation phases of these contracts,
despite experiencing certain operational issues, we believed these contracts could be fully performed on a timely basis and remain profitable. In
2003, after experiencing numerous delays in product delivery and functionality, we conducted a reassessment of the contract delivery and
project methodology, including assessment of our third party vendors’ ability to perform under these contracts. We determined that certain
contract obligations, including software functionality, could not be met within existing contract cost estimates and delivery dates. Accordingly,
in 2003, we reassessed our estimate of the costs to fulfill our contract obligations and recorded a $51.0 million provision for the expected
contract losses.
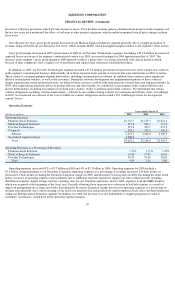
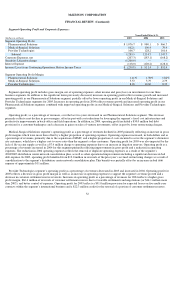
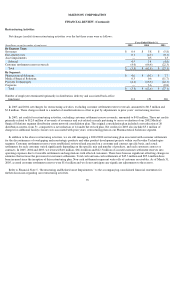
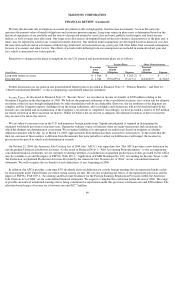
Operating Expenses:
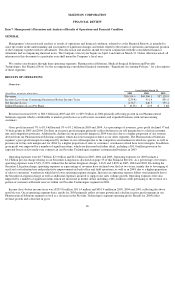
Operating expenses increased 61% to $3.7 billion in 2005 and 4% to $2.3 billion in 2004. Operating expenses for 2005 include a
$1.2 billion charge pertaining to our Securities Litigation. Operating expenses as a percentage of revenues increased 128 basis points (or
decreased 21 basis points excluding the Securities Litigation charge) in 2005 and decreased 54 basis points in 2004. Excluding the items noted
below, increases in operating expenses were primarily due to additional expenses incurred to support our sales volume growth, including
distribution expenses, higher foreign currency exchange rates for our Canadian operations, and for 2005, expenses from the MMC business
which was acquired at the beginning of the fiscal year. Partially offsetting these increases was a decrease in bad debt expense as a result of
improved management of accounts receivable. Excluding the Securities Litigation charge, decreases in operating expenses as a percentage of
revenue were primarily due to the leveraging of our fixed cost infrastructure and productivity improvements in back-office and field operations
within our Pharmaceutical Solutions segment. In addition, for 2004, the decrease was also attributable to a higher proportion of sales to
customers’ warehouses, which have lower operating expense margins.
30
Years Ended March 31,
(Dollars in millions) 2005 2004 2003
Operating Expenses
Pharmaceutical Solutions $1,151.5 $1,119.3 $1,021.2
Medical-Surgical Solutions 555.8 501.2 511.9
Provider Technologies 513.8 450.7 473.5
Corporate 234.1 193.6 162.9
Subtotal 2,455.2 2,264.8 2,169.5
Securities Litigation charge 1,200.0
—
—
Total $3,655.2 $2,264.8 $2,169.5
Operating Expenses as a Percentage of Revenues
Pharmaceutical Solutions 1.51% 1.71% 1.92%
Medical-Surgical Solutions 19.20 17.83 18.01
Provider Technologies 39.47 37.48 38.84
Total 4.54 3.26 3.80