McKesson 2005 Annual Report Download - page 57
Download and view the complete annual report
Please find page 57 of the 2005 McKesson annual report below. You can navigate through the pages in the report by either clicking on the pages listed below, or by using the keyword search tool below to find specific information within the annual report.-
 1
1 -
2
-
3
-
4
-
5
-
6
-
7
-
8
-
9
-
10
-
11
-
12
-
13
-
14
-
15
-
16
-
17
-
18
-
19
-
20
-
21
-
22
-
23
-
24
-
25
-
26
-
27
-
28
-
29
-
30
-
31
-
32
-
33
-
34
-
35
-
36
-
37
-
38
-
39
-
40
-
41
-
42
-
43
-
44
-
45
-
46
-
 47
47 -
 48
48 -
 49
49 -
 50
50 -
 51
51 -
 52
52 -
 53
53 -
 54
54 -
 55
55 -
 56
56 -
 57
57 -
 58
58 -
 59
59 -
 60
60 -
 61
61 -
 62
62 -
 63
63 -
 64
64 -
 65
65 -
 66
66 -
 67
67 -
68
-
69
-
70
-
71
-
72
-
73
-
74
-
75
-
76
-
77
-
78
-
79
-
80
-
81
-
82
-
83
-
84
-
85
-
86
-
87
-
88
-
89
-
90
-
91
-
92
-
93
-
94
-
95
-
96
-
97
-
98
-
99
-
100
-
101
-
102
-
103
-
104
-
105
-
106
-
107
-
108
-
109
-
110
-
111
-
112
-
113
-
114
-
115
-
116
-
117
-
118
-
119
-
120
-
121
-
122
-
123
-
124
-
125
-
126
-
127
-
128
-
129
-
130
-
131
-
132
-
133
-
134
-
135
-
136
-
137
-
138
-
139
-
140
-
141
-
142
-
143
-
144
-
145
-
146
-
147
-
148
-
149
-
150
-
151
-
152
-
153
-
154
-
155
-
156
-
157
-
158
-
159
-
160
-
161
-
162
-
163
-
164
-
165
-
166
-
167
-
168
-
169
-
170
-
171
-
172
-
173
-
174
-
175
-
176
-
177
-
178
-
179
-
180
-
181
-
182
-
183
-
184
-
185
-
186
-
187
-
188
-
189
-
190
-
191
-
192
-
193
-
194
-
195
-
196
-
197
-
198
-
199
-
200
-
201
-
202
-
203
-
204
-
205
-
206
-
207
-
208
-
209
-
210
-
211
-
212
-
213
-
214
-
215
-
216
-
217
-
218
-
219
-
220
-
221
-
222
-
223
-
224
-
225
-
226
-
227
-
228
-
229
-
230
-
231
-
232
-
233
-
234
-
235
-
236
-
237
-
238
-
239
-
240
-
241
-
242
-
243
-
244
-
245
-
246
-
247
-
248
-
249
-
250
-
251
-
252
-
253
-
254
-
255
-
256
-
257
-
258
-
259
-
260
-
261
-
262
-
263
-
264
-
265
-
266
-
267
-
268
-
269
-
270
-
271
-
272
-
273
-
274
-
275
-
276
-
277
-
278
-
279
-
280
-
281
-
282
-
283
-
284
-
285
-
286
-
287
-
288
-
289
-
290
-
291
-
292
-
293
-
294
-
295
-
296
-
297
-
298
-
299
-
300
-
301
-
302
-
303
-
304
-
305
-
306
-
307
-
308
-
309
-
310
-
311
-
312
-
313
-
314
-
315
-
316
-
317
-
318
-
319
-
320
-
321
-
322
-
323
-
324
-
325
-
326
-
327
-
328
-
329
-
330
-
331
-
332
-
333
-
334
-
335
-
336
-
337
-
338
-
339
-
340
 |
 |

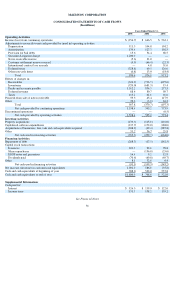
McKESSON CORPORATION
CONSOLIDATED STATEMENTS OF CASH FLOWS
(In millions)
See Financial Notes
56
Years Ended March 31,
2005 2004 2003
O
p
eratin
g
Activities
Income (loss) from continuing operations $ (156.7) $ 646.5 $ 562.1
Adjustments to reconcile to net cash provided by (used in) operating activities:
Depreciation 111.5 104.8 101.2
Amortization 139.4 127.3 102.5
Provision for bad debts 15.6 54.4 68.5
Securities Litigation charge 1,200.0
—
—
Notes receivable reserve (5.6) 21.0
—
Customer settlement reserve reversal (4.0) (66.4)(22.3)
International contract loss accruals — 4.8 51.0
Deferred taxes (328.8) 69.5 126.6
Other non-cash items (0.8) 13.0 (18.4)
Total 970.6 974.9 971.2
Effects of changes in:
Receivables (324.9) (716.7)(697.6)
Inventories (720.0) (681.3) 13.4
Drafts and accounts payable 1,312.2 834.5 277.5
Deferred revenue 88.4 80.7 50.7
Taxes 113.2 61.6 16.6
Proceeds from sale of notes receivable 59.3 45.4 117.9
Other 39.6 (3.9) 24.2
Total 567.8 (379.7) (197.3)
Net cash provided by continuing operations 1,538.4 595.2 773.9
Discontinued operations —
—
(0.5)
Net cash provided by operating activities 1,538.4 595.2 773.4
Investin
g
Activities
Property acquisitions (139.9) (115.0)(116.0)
Capitalized software expenditures (137.7) (172.0) (188.0)
Acquisitions of businesses, less cash and cash equivalents acquired (108.9) (49.4)(385.8)
Other 31.2 36.7 25.8
Net cash used in investing activities (355.3) (299.7)(664.0)
Financin
g
Activities
Repayment of debt (268.3) (17.5) (142.5)
Capital stock transactions:
Issuances 223.3 92.6 78.8
Share repurchases — (156.8) (25.0)
ESOP notes and guarantees 16.4 9.2 12.8
Dividends paid (70.6) (69.8) (69.7)
Other 8.1 32.8 0.4
Net cash used in financing activities (91.1) (109.5) (145.2)
Net increase (decrease) in cash and cash equivalents 1,092.0 186.0 (35.8)
Cash and cash equivalents at beginning of year 708.0 522.0 557.8
Cash and cash equivalents at end of year $1,800.0 $ 708.0 $522.0
Su
pp
lemental Information:
Cash paid for:
Interes
t
$ 126.3 $ 119.9 $ 122.0
Income taxes 131.7 138.2 139.2