McKesson 2005 Annual Report Download - page 39
Download and view the complete annual report
Please find page 39 of the 2005 McKesson annual report below. You can navigate through the pages in the report by either clicking on the pages listed below, or by using the keyword search tool below to find specific information within the annual report.-
 1
1 -
2
-
3
-
4
-
5
-
6
-
7
-
8
-
9
-
10
-
11
-
12
-
13
-
14
-
15
-
16
-
17
-
18
-
19
-
20
-
21
-
22
-
23
-
24
-
25
-
26
-
27
-
28
-
 29
29 -
 30
30 -
 31
31 -
 32
32 -
 33
33 -
 34
34 -
 35
35 -
 36
36 -
 37
37 -
 38
38 -
 39
39 -
 40
40 -
 41
41 -
 42
42 -
 43
43 -
 44
44 -
 45
45 -
 46
46 -
 47
47 -
 48
48 -
 49
49 -
50
-
51
-
52
-
53
-
54
-
55
-
56
-
57
-
58
-
59
-
60
-
61
-
62
-
63
-
64
-
65
-
66
-
67
-
68
-
69
-
70
-
71
-
72
-
73
-
74
-
75
-
76
-
77
-
78
-
79
-
80
-
81
-
82
-
83
-
84
-
85
-
86
-
87
-
88
-
89
-
90
-
91
-
92
-
93
-
94
-
95
-
96
-
97
-
98
-
99
-
100
-
101
-
102
-
103
-
104
-
105
-
106
-
107
-
108
-
109
-
110
-
111
-
112
-
113
-
114
-
115
-
116
-
117
-
118
-
119
-
120
-
121
-
122
-
123
-
124
-
125
-
126
-
127
-
128
-
129
-
130
-
131
-
132
-
133
-
134
-
135
-
136
-
137
-
138
-
139
-
140
-
141
-
142
-
143
-
144
-
145
-
146
-
147
-
148
-
149
-
150
-
151
-
152
-
153
-
154
-
155
-
156
-
157
-
158
-
159
-
160
-
161
-
162
-
163
-
164
-
165
-
166
-
167
-
168
-
169
-
170
-
171
-
172
-
173
-
174
-
175
-
176
-
177
-
178
-
179
-
180
-
181
-
182
-
183
-
184
-
185
-
186
-
187
-
188
-
189
-
190
-
191
-
192
-
193
-
194
-
195
-
196
-
197
-
198
-
199
-
200
-
201
-
202
-
203
-
204
-
205
-
206
-
207
-
208
-
209
-
210
-
211
-
212
-
213
-
214
-
215
-
216
-
217
-
218
-
219
-
220
-
221
-
222
-
223
-
224
-
225
-
226
-
227
-
228
-
229
-
230
-
231
-
232
-
233
-
234
-
235
-
236
-
237
-
238
-
239
-
240
-
241
-
242
-
243
-
244
-
245
-
246
-
247
-
248
-
249
-
250
-
251
-
252
-
253
-
254
-
255
-
256
-
257
-
258
-
259
-
260
-
261
-
262
-
263
-
264
-
265
-
266
-
267
-
268
-
269
-
270
-
271
-
272
-
273
-
274
-
275
-
276
-
277
-
278
-
279
-
280
-
281
-
282
-
283
-
284
-
285
-
286
-
287
-
288
-
289
-
290
-
291
-
292
-
293
-
294
-
295
-
296
-
297
-
298
-
299
-
300
-
301
-
302
-
303
-
304
-
305
-
306
-
307
-
308
-
309
-
310
-
311
-
312
-
313
-
314
-
315
-
316
-
317
-
318
-
319
-
320
-
321
-
322
-
323
-
324
-
325
-
326
-
327
-
328
-
329
-
330
-
331
-
332
-
333
-
334
-
335
-
336
-
337
-
338
-
339
-
340
 |
 |

McKESSON CORPORATION
FINANCIAL REVIEW (Continued)
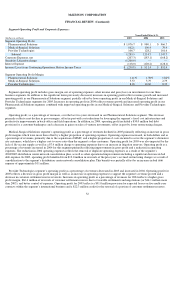
We have historically used the Black-Scholes option pricing model in determining the fair value of the stock options for our stock-based
compensation disclosures. Key assumptions for this option pricing model include the expected term of the option, stock price volatility, risk-
free interest rate and dividend yield. Many of these assumptions are judgmental and highly sensitive in the determination of the option’s fair
value and hence the related compensation expense. The expected term of the option represents the period of time that options are expected to
remain outstanding and is derived from historical data on option exercises. Expected volatility is based on historical volatility of our common
stock over a period of time that approximates the expected term. The risk-free interest rate is based on the U.S. Treasury rate in effect at the
time of grant with a remaining term equal to the expected term of the option. We calculate the expected dividend yield using the historical
annual dividend payments and the expected future stock price. An increase in the expected term of the option, stock price volatility and/or risk-
free interest rate will increase compensation expense. An increase in the dividend yield will decrease compensation expense.
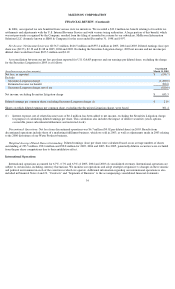
Had we accounted for employee stock options based on fair value for all awards that vested during the year, net loss and net loss per share
for 2005 would have been $207.7 million and $0.71 compared to the reported net loss and net loss per share of $156.7 million and $0.53. Pro
forma amounts including stock-based compensation were impacted by certain stock option vesting period accelerations and as a result, are not
indicative of future estimated stock-based compensation expense.
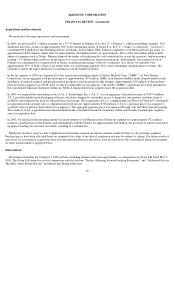
Historically, options granted by the Company generally vest over four years and have a term of seven or ten years. However, for employee
retention purposes and in anticipation of the requirements of SFAS No. 123(R), in 2004, the Compensation Committee of the Company’s
Board of Directors (the “Committee”) approved the accelerated vesting of substantially all unvested stock options outstanding at that time.
Furthermore in 2005, the Committee approved a shorter vesting period for approximately 6 million stock options that were granted during the
year. These 2005 options were fully vested by March 31, 2005. As SFAS No. 123(R) compensation expense is typically amortized over the
related vesting period, the stock options that received accelerated vesting in 2004 did not impact the pro forma expense in 2005. Offsetting this
decrease, was the significant pro forma expense associated with the 2005 stock options that received a shorter vesting period.
We are currently assessing the impact of SFAS No. 123(R) on our consolidated financial statements. As part of this assessment, we are
evaluating modifications to our long-term compensation program for key employees across the Company, which may limit stock option grants
in favor of restricted share grants and long-term, performance-based cash compensation. Nevertheless, we do believe that this standard could
have a material impact on our consolidated financial statements.
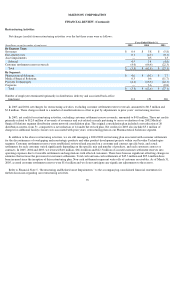
Securities Litigation: As discussed in Financial Note 19, “Other Commitments and Contingent Liabilities,” to the accompanying
consolidated financial statements, in the third quarter of 2005, we announced that we had reached an agreement to settle the action captioned In
re McKesson HBOC, Inc. Securities Litigation (N.D. Cal. Case No. C-99-20743-RMW) (the “Consolidated Action”). In general, under the
agreement to settle the Consolidated Action, we will pay the settlement class a total of $960 million in cash. The settlement agreement is
subject to various conditions, including, but not limited to, preliminary approval by the Court, notice to the Class, and final approval by the
Court after a hearing. Other than the Consolidated Action, none of the previously reported Securities Litigation has been resolved by the
settlement described above. As a result, during the third quarter of 2005, we recorded a pre-tax charge totaling $1.2 billion ($810.0 million
after-tax) for the Securities Litigation charge, which consists of $960 million settlement payment and $240 million reserve. In addition, for the
litigation costs not covered under our directors and officers’ liability insurance policies, we accrue costs when it is probable that a liability has
been incurred and the amount can be reasonably estimated. We expensed $42.8 million, $17.7 million and $3.9 million in 2005, 2003 and 2002
in connection with these matters.
We believe these recorded amounts will be adequate to address our remaining potential exposures in relation with the Securities Litigation.
However, in view of the number of remaining cases, the uncertainties of the timing and outcome of this type of litigation, and the substantial
amounts involved, it is possible that the ultimate costs of these matters may exceed or be below the reserve.
Pension and Other Postretirement Benefits: Our pension and other postretirement benefit costs and obligations are dependent upon various
actuarial assumptions used in calculating such amounts. Our major assumptions for determining net pension and postretirement benefit costs
include the discount rate, long-term return on assets, and medical cost trends rates. We evaluate these critical assumptions at least annually.
39