McKesson 2005 Annual Report Download - page 59
Download and view the complete annual report
Please find page 59 of the 2005 McKesson annual report below. You can navigate through the pages in the report by either clicking on the pages listed below, or by using the keyword search tool below to find specific information within the annual report.-
 1
1 -
2
-
3
-
4
-
5
-
6
-
7
-
8
-
9
-
10
-
11
-
12
-
13
-
14
-
15
-
16
-
17
-
18
-
19
-
20
-
21
-
22
-
23
-
24
-
25
-
26
-
27
-
28
-
29
-
30
-
31
-
32
-
33
-
34
-
35
-
36
-
37
-
38
-
39
-
40
-
41
-
42
-
43
-
44
-
45
-
46
-
47
-
48
-
 49
49 -
 50
50 -
 51
51 -
 52
52 -
 53
53 -
 54
54 -
 55
55 -
 56
56 -
 57
57 -
 58
58 -
 59
59 -
 60
60 -
 61
61 -
 62
62 -
 63
63 -
 64
64 -
 65
65 -
 66
66 -
 67
67 -
 68
68 -
 69
69 -
70
-
71
-
72
-
73
-
74
-
75
-
76
-
77
-
78
-
79
-
80
-
81
-
82
-
83
-
84
-
85
-
86
-
87
-
88
-
89
-
90
-
91
-
92
-
93
-
94
-
95
-
96
-
97
-
98
-
99
-
100
-
101
-
102
-
103
-
104
-
105
-
106
-
107
-
108
-
109
-
110
-
111
-
112
-
113
-
114
-
115
-
116
-
117
-
118
-
119
-
120
-
121
-
122
-
123
-
124
-
125
-
126
-
127
-
128
-
129
-
130
-
131
-
132
-
133
-
134
-
135
-
136
-
137
-
138
-
139
-
140
-
141
-
142
-
143
-
144
-
145
-
146
-
147
-
148
-
149
-
150
-
151
-
152
-
153
-
154
-
155
-
156
-
157
-
158
-
159
-
160
-
161
-
162
-
163
-
164
-
165
-
166
-
167
-
168
-
169
-
170
-
171
-
172
-
173
-
174
-
175
-
176
-
177
-
178
-
179
-
180
-
181
-
182
-
183
-
184
-
185
-
186
-
187
-
188
-
189
-
190
-
191
-
192
-
193
-
194
-
195
-
196
-
197
-
198
-
199
-
200
-
201
-
202
-
203
-
204
-
205
-
206
-
207
-
208
-
209
-
210
-
211
-
212
-
213
-
214
-
215
-
216
-
217
-
218
-
219
-
220
-
221
-
222
-
223
-
224
-
225
-
226
-
227
-
228
-
229
-
230
-
231
-
232
-
233
-
234
-
235
-
236
-
237
-
238
-
239
-
240
-
241
-
242
-
243
-
244
-
245
-
246
-
247
-
248
-
249
-
250
-
251
-
252
-
253
-
254
-
255
-
256
-
257
-
258
-
259
-
260
-
261
-
262
-
263
-
264
-
265
-
266
-
267
-
268
-
269
-
270
-
271
-
272
-
273
-
274
-
275
-
276
-
277
-
278
-
279
-
280
-
281
-
282
-
283
-
284
-
285
-
286
-
287
-
288
-
289
-
290
-
291
-
292
-
293
-
294
-
295
-
296
-
297
-
298
-
299
-
300
-
301
-
302
-
303
-
304
-
305
-
306
-
307
-
308
-
309
-
310
-
311
-
312
-
313
-
314
-
315
-
316
-
317
-
318
-
319
-
320
-
321
-
322
-
323
-
324
-
325
-
326
-
327
-
328
-
329
-
330
-
331
-
332
-
333
-
334
-
335
-
336
-
337
-
338
-
339
-
340
 |
 |

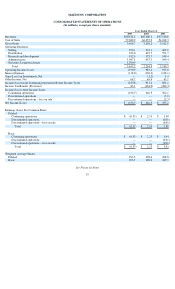
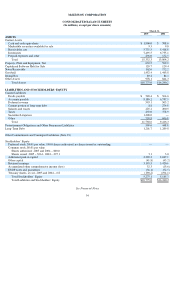
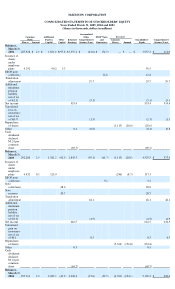
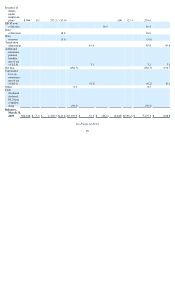
McKESSON CORPORATION
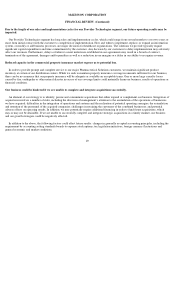
FINANCIAL NOTES (Continued)
Use of Estimates. The preparation of financial statements in conformity with accounting principles generally accepted in the United States
of America requires that we make estimates and assumptions that affect the reported amounts of assets and liabilities and disclosure of
contingent assets and liabilities as of the date of the financial statements and the reported amounts of revenues and expenses during the
reporting period. Actual results could differ from those estimates.
Cash and Cash Equivalents include all highly liquid debt instruments purchased with a maturity of three months or less at the date of
acquisition.
Marketable Securities Available for Sale are carried at fair value and the net unrealized gains and losses, net of the related tax effect,
computed in marking these securities to market have been reported within stockholders’ equity.
Inventories are stated at the lower of cost or market. Inventories for the Pharmaceutical Solutions and Medical-Surgical Solutions segments
consist of merchandise held for resale. For our Pharmaceutical Solutions segment, the majority of the cost of domestic inventories is
determined on the last-in, first-out (“LIFO”) method and international inventories are stated using the first-in, first-out (“FIFO”) method. Cost
of inventories for our Medical-Surgical Solutions segment is primarily determined on the FIFO method. Provider Technologies segment
inventories consist of computer hardware with cost determined either by the specific identification or the FIFO method. The LIFO method is
used to value approximately 90% of our inventories at March 31, 2005 and 2004. Total inventories before the LIFO cost adjustment, which
approximates replacement cost, were $7,682.7 million and $6,981.5 million at March 31, 2005 and 2004. Vendor rebates, allowances and
chargebacks received from vendors are generally accounted for as a reduction in the cost of inventory and are recognized when the inventory is
sold.
Property, Plant and Equipment is stated at cost and depreciated on the straight-line method at rates designed to distribute the cost of
properties over estimated service lives ranging from one to 30 years.
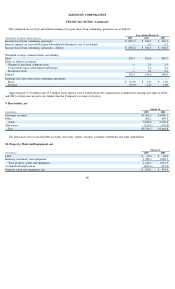
Capitalized Software Held for Sale consists of development costs for software held for sale primarily for our Provider Technologies
segment. Such costs are capitalized once a project has reached the point of technological feasibility. Completed projects are amortized after
reaching the point of general availability using the straight-line method based on an estimated useful life of approximately three years. We
monitor the net realizable value of capitalized software held for sale to ensure that the investment will be recovered through future sales.
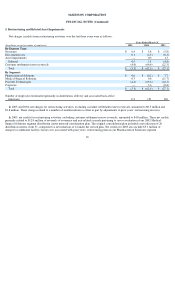
Additional information regarding our capitalized software expenditures is as follows:
Long-lived Assets. We assess the recoverability of goodwill on at least an annual basis and other long-lived assets when events or changes in
circumstances indicate that the carrying amount of an asset may not be recoverable. Measurement of impairment losses for long-lived assets,
including goodwill, which we expect to hold and use, is based on estimated fair values of the assets. Estimates of fair values are based on
quoted market prices, when available, the results of valuation techniques utilizing discounted cash flows (using the lowest level of identifiable
cash flows) or fundamental analysis. Long-lived assets to be disposed of, either by sale or abandonment, are reported at the lower of carrying
amount or fair value less costs to sell.
58
Years Ended March 31,
(In millions) 2005 2004 2003
Amounts capitalized $49.5 $ 57.7 $53.8
Amortization expense 51.9 53.2 44.3
Third-party royalty fees paid 25.2 25.0 24.9