American Airlines 2006 Annual Report Download - page 104
Download and view the complete annual report
Please find page 104 of the 2006 American Airlines annual report below. You can navigate through the pages in the report by either clicking on the pages listed below, or by using the keyword search tool below to find specific information within the annual report.-
 1
1 -
2
-
3
-
4
-
5
-
6
-
7
-
8
-
9
-
10
-
11
-
12
-
13
-
14
-
15
-
16
-
17
-
18
-
19
-
20
-
21
-
22
-
23
-
24
-
25
-
26
-
27
-
28
-
29
-
30
-
31
-
32
-
33
-
34
-
35
-
36
-
37
-
38
-
39
-
40
-
41
-
42
-
43
-
44
-
45
-
46
-
47
-
48
-
49
-
50
-
51
-
52
-
53
-
54
-
55
-
56
-
57
-
58
-
59
-
60
-
61
-
62
-
63
-
64
-
65
-
66
-
67
-
68
-
69
-
70
-
71
-
72
-
73
-
74
-
75
-
76
-
77
-
78
-
79
-
80
-
81
-
82
-
83
-
84
-
85
-
86
-
87
-
88
-
89
-
90
-
91
-
92
-
93
-
 94
94 -
 95
95 -
 96
96 -
 97
97 -
 98
98 -
 99
99 -
 100
100 -
 101
101 -
 102
102 -
 103
103 -
 104
104 -
 105
105 -
 106
106 -
 107
107 -
 108
108 -
 109
109 -
 110
110 -
 111
111 -
 112
112 -
 113
113
 |
 |

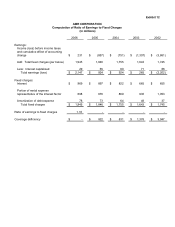
Exhibit 12
AMR CORPORATION
Computation of Ratio of Earnings to Fixed Charges
(in millions)
2006 2005 2004 2003 2002
Earnings:
Income (loss) before income taxes
and cumulative effect of accounting
change
$ 231
$ (857)
$ (751)
$ (1,307)
$ (3,861)
Add: Total fixed charges (per below) 1,945 1,846 1,755 1,643 1,745
Less: Interest capitalized 29 65 80 71 86
Total earnings (loss) $ 2,147 $ 924 $ 924 $ 265 $ (2,202)
Fixed charges:
Interest $ 969 $ 897 $ 822 $ 665 $ 655
Portion of rental expense
representative of the interest factor
898
876
869
930
1,053
Amortization of debt expense 78 73 64 48 37
Total fixed charges $ 1,945 $ 1,846 $ 1,755 $ 1,643 $ 1,745
Ratio of earnings to fixed charges 1.10 - - - -
Coverage deficiency $ - $ 922 $ 831 $ 1,378 $ 3,947