American Airlines 2006 Annual Report Download - page 70
Download and view the complete annual report
Please find page 70 of the 2006 American Airlines annual report below. You can navigate through the pages in the report by either clicking on the pages listed below, or by using the keyword search tool below to find specific information within the annual report.-
 1
1 -
2
-
3
-
4
-
5
-
6
-
7
-
8
-
9
-
10
-
11
-
12
-
13
-
14
-
15
-
16
-
17
-
18
-
19
-
20
-
21
-
22
-
23
-
24
-
25
-
26
-
27
-
28
-
29
-
30
-
31
-
32
-
33
-
34
-
35
-
36
-
37
-
38
-
39
-
40
-
41
-
42
-
43
-
44
-
45
-
46
-
47
-
48
-
49
-
50
-
51
-
52
-
53
-
54
-
55
-
56
-
57
-
58
-
59
-
 60
60 -
 61
61 -
 62
62 -
 63
63 -
 64
64 -
 65
65 -
 66
66 -
 67
67 -
 68
68 -
 69
69 -
 70
70 -
 71
71 -
 72
72 -
 73
73 -
 74
74 -
 75
75 -
 76
76 -
 77
77 -
 78
78 -
 79
79 -
 80
80 -
81
-
82
-
83
-
84
-
85
-
86
-
87
-
88
-
89
-
90
-
91
-
92
-
93
-
94
-
95
-
96
-
97
-
98
-
99
-
100
-
101
-
102
-
103
-
104
-
105
-
106
-
107
-
108
-
109
-
110
-
111
-
112
-
113
 |
 |

66
7. Financial Instruments and Risk Management (Continued)
For the years ended December 31, 2006, 2005 and 2004, the Company recognized net gains of approximately
$97 million, $64 million and $99 million, respectively, as a component of fuel expense on the accompanying
consolidated statements of operations related to its fuel hedging agreements. In addition, in 2006, the Company
recognized a loss of $102 million in Miscellaneous – net for changes in market value of hedges that did not qualify
for hedge accounting during certain periods in 2006. The fair value of the Company’s fuel hedging agreements at
December 31, 2006 and 2005, representing the amount the Company would receive to terminate the agreements,
totaled $23 million and $122 million, respectively.
Foreign Exchange Risk Management
The Company has entered into Japanese yen currency exchange agreements to hedge certain yen-based capital
lease obligations (effectively converting these obligations into dollar-based obligations). The Company accounts
for its Japanese yen currency exchange agreements as cash flow hedges whereby the fair value of the related
Japanese yen currency exchange agreements is reflected in Other liabilities and deferred credits and
Accumulated other comprehensive loss on the accompanying consolidated balance sheets. The Company has
no ineffectiveness with regard to its Japanese yen currency exchange agreements. The fair values of the
Company’s yen currency exchange agreements, representing the amount the Company would pay to terminate
the agreements, were $35 million and $39 million as of December 31, 2006 and 2005, respectively. The
exchange rates on the Japanese yen agreements range from 75.05 to 99.65 yen per U.S. dollar. The actual
exchange rate was 119.07 and 117.75 yen per U.S. dollar at December 31, 2006 and 2005, respectively.
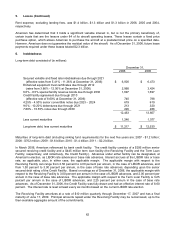
Fair Values of Financial Instruments
The fair values of the Company's long-term debt were estimated using quoted market prices where available. For
long-term debt not actively traded, fair values were estimated using discounted cash flow analyses, based on the
Company's current incremental borrowing rates for similar types of borrowing arrangements. The carrying
amounts and estimated fair values of the Company's long-term debt, including current maturities, were (in
millions):
December 31,
2006 2005
Carrying
Value
Fair
Value
Carrying
Value
Fair
Value
Secured variable and fixed rate
indebtedness
$ 6,000
$ 5,574
$ 6,473
$ 5,761
Enhanced equipment trust
certificates
2,968
3,068
3,424
3,414
6.0% - 8.5% special facility revenue
bonds
1,697
1,978
1,697
1,673
Credit facility agreement 740 743 788 791
4.25% - 4.50 % senior convertible
notes
619
1,037
619
800
9.0% - 10.20% debentures 213 222 320 271
7.88% - 10.55% notes 226 220 286 206
$ 12,463 $ 12,842 $ 13,607 $ 12,916