American Airlines 2006 Annual Report Download - page 75
Download and view the complete annual report
Please find page 75 of the 2006 American Airlines annual report below. You can navigate through the pages in the report by either clicking on the pages listed below, or by using the keyword search tool below to find specific information within the annual report.-
 1
1 -
2
-
3
-
4
-
5
-
6
-
7
-
8
-
9
-
10
-
11
-
12
-
13
-
14
-
15
-
16
-
17
-
18
-
19
-
20
-
21
-
22
-
23
-
24
-
25
-
26
-
27
-
28
-
29
-
30
-
31
-
32
-
33
-
34
-
35
-
36
-
37
-
38
-
39
-
40
-
41
-
42
-
43
-
44
-
45
-
46
-
47
-
48
-
49
-
50
-
51
-
52
-
53
-
54
-
55
-
56
-
57
-
58
-
59
-
60
-
61
-
62
-
63
-
64
-
 65
65 -
 66
66 -
 67
67 -
 68
68 -
 69
69 -
 70
70 -
 71
71 -
 72
72 -
 73
73 -
 74
74 -
 75
75 -
 76
76 -
 77
77 -
 78
78 -
 79
79 -
 80
80 -
 81
81 -
 82
82 -
 83
83 -
 84
84 -
 85
85 -
86
-
87
-
88
-
89
-
90
-
91
-
92
-
93
-
94
-
95
-
96
-
97
-
98
-
99
-
100
-
101
-
102
-
103
-
104
-
105
-
106
-
107
-
108
-
109
-
110
-
111
-
112
-
113
 |
 |

71
9. Share Based Compensation (Continued)
A summary of stock option/SSARs activity under the LTIP Plans, the 2003 Plan and the Pilot Plan as of
December 31, 2006, and changes during the year then ended is presented below:
LTIP Plans The Pilot Plan and the 2003 Plan
Options/SSARs
Weighted
Average
Exercise
Price
Options
Weighted
Average
Exercise
Price
Outstanding at January 1 19,279,192 $ 25.70 39,773,837 $ 8.35
Granted 796,250 23.68 18,830 19.49
Exercised (4,053,551) 20.57 (18,061,415) 8.93
Forfeited or Expired (419,563) 22.03 (171,818) 6.55
Outstanding at December 31
15,602,328
$ 27.03
21,559,434
$ 7.89
Exercisable at December 31
13,194,458
$ 28.71
20,015,199
$ 7.64
Weighted Average Remaining
Contractual Term of Options
Outstanding (in years)
4.1
5.3
Aggregate Intrinsic Value of
Options Outstanding
$ 49,943,248
$ 481,669,842
The aggregate intrinsic value of all vested options/SSARs is $472 million and those options have an average
remaining contractual life of 4.5 years. The weighted-average grant date fair value of options/SSARs granted
during 2006, 2005 and 2004 was $10.93, $6.28 and $4.23, respectively. The total intrinsic value of
options/SSARs exercised during 2006, 2005 and 2004 was $350 million, $75 million and $7 million, respectively.
A summary of the status of the Company’s non-vested options/SSARs under all plans as of December 31, 2006,
and changes during the year ended December 31, 2006, is presented below:
Weighted
Options/SSARs
Average
Grant Date Fair
Value
Outstanding at January 1 16,838,541 $ 3.55
Granted 815,080 10.90
Vested (13,396,444) 2.96
Forfeited (305,072) 4.54
Outstanding at December 31
3,952,105
$ 6.98
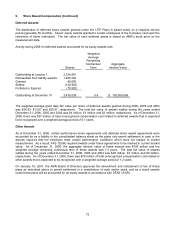
As of December 31, 2006, there was $17 million of total unrecognized compensation cost related to non-vested
stock options/SSARs granted under the LTIP Plans, the 2003 Plan and the Pilot Plan that is expected to be
recognized over a weighted-average period of 2.7 years. The total fair value of stock options/SSARs vested
during the years ended December 31, 2006, 2005 and 2004, was $25 million, $42 million and $64 million,
respectively.