American Airlines 2006 Annual Report Download - page 47
Download and view the complete annual report
Please find page 47 of the 2006 American Airlines annual report below. You can navigate through the pages in the report by either clicking on the pages listed below, or by using the keyword search tool below to find specific information within the annual report.-
 1
1 -
2
-
3
-
4
-
5
-
6
-
7
-
8
-
9
-
10
-
11
-
12
-
13
-
14
-
15
-
16
-
17
-
18
-
19
-
20
-
21
-
22
-
23
-
24
-
25
-
26
-
27
-
28
-
29
-
30
-
31
-
32
-
33
-
34
-
35
-
36
-
 37
37 -
 38
38 -
 39
39 -
 40
40 -
 41
41 -
 42
42 -
 43
43 -
 44
44 -
 45
45 -
 46
46 -
 47
47 -
 48
48 -
 49
49 -
 50
50 -
 51
51 -
 52
52 -
 53
53 -
 54
54 -
 55
55 -
 56
56 -
 57
57 -
58
-
59
-
60
-
61
-
62
-
63
-
64
-
65
-
66
-
67
-
68
-
69
-
70
-
71
-
72
-
73
-
74
-
75
-
76
-
77
-
78
-
79
-
80
-
81
-
82
-
83
-
84
-
85
-
86
-
87
-
88
-
89
-
90
-
91
-
92
-
93
-
94
-
95
-
96
-
97
-
98
-
99
-
100
-
101
-
102
-
103
-
104
-
105
-
106
-
107
-
108
-
109
-
110
-
111
-
112
-
113
 |
 |

43
Revenue earned from selling AAdvantage miles to other companies is recognized in two components. The
first component represents the revenue for air transportation sold and is valued at fair value. This revenue
is deferred and recognized over the period the mileage is expected to be used, which is currently estimated
to be 28 months. The second revenue component, representing the marketing services sold is recognized
as related services are provided.
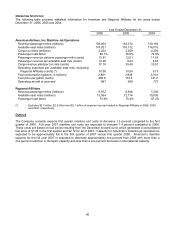
The number of free travel awards used for travel on American and American Eagle was 2.6 million in both
2006 and 2005 representing approximately 7.5 percent and 7.2 percent of passengers boarded. The
Company believes displacement of revenue passengers is minimal given the Company’s load factors, its
ability to manage frequent flyer seat inventory, and the relatively low ratio of free award usage to total
passengers boarded.
Changes to the percentage of the amount of revenue deferred, deferred recognition period, percentage of
awards expected to be redeemed for travel on participating airlines or cost per mile estimates could have a
significant impact on the Company’s revenues or incremental cost accrual in the year of the change as well
as in future years.
Stock Compensation – Effective January 1, 2006, the Company adopted the fair value recognition
provisions of Statement of Financial Accounting Standards No. 123(R) "Share-Based Payment". The
Company grants awards under its various share based payment plans and utilizes option pricing models or
fair value models to estimate the fair value of its awards. Certain awards contain a market performance
condition, which is taken into account in estimating the fair value on the date of grant. The fair value of
those awards is estimated using a Monte Carlo valuation model that estimates the probability of the
potential payouts of these awards, using the historical volatility of the Company's stock and the stock of
other carriers in the competitor group. The Company accounts for these awards over the three year term of
the award based on the grant date fair value, provided adequate shares are available to settle the awards.
For awards where adequate shares are not anticipated to be available or that only permit settlement in
cash, the fair value is re-measured each reporting period.
Pensions and other postretirement benefits – On December 31, 2006, the Company adopted Statement of
Accounting Standard 158 “Employers’ Accounting for Defined Benefit Pension and Other Postretirement
Plans” (SFAS 158). SFAS 158 required the Company to recognize the funded status (i.e., the difference
between the fair value of plan assets and the projected benefit obligations) of its pension and
postretirement plans in the consolidated balance sheet as of December 31, 2006 with a corresponding
adjustment to accumulated other comprehensive loss.
The Company’s pension and other postretirement benefit costs and liabilities are calculated using various
actuarial assumptions and methodologies. The Company uses certain assumptions including, but not
limited to, the selection of the: (i) discount rate; (ii) expected return on plan assets; and (iii) expected health
care cost trend rate.
These assumptions as of December 31 were:
2006 2005
Discount rate 6.00% 5.75%
Expected return on plan assets 8.75% 8.75%
Expected health care cost trend rate:
Pre-65 individuals
Initial 9.0% 4.5%
Ultimate 4.5% 4.5%
Post-65 individuals
Initial 9.0% 9.0%
Ultimate (2010) 4.5% 4.5%