American Airlines 2006 Annual Report Download - page 44
Download and view the complete annual report
Please find page 44 of the 2006 American Airlines annual report below. You can navigate through the pages in the report by either clicking on the pages listed below, or by using the keyword search tool below to find specific information within the annual report.-
 1
1 -
2
-
3
-
4
-
5
-
6
-
7
-
8
-
9
-
10
-
11
-
12
-
13
-
14
-
15
-
16
-
17
-
18
-
19
-
20
-
21
-
22
-
23
-
24
-
25
-
26
-
27
-
28
-
29
-
30
-
31
-
32
-
33
-
 34
34 -
 35
35 -
 36
36 -
 37
37 -
 38
38 -
 39
39 -
 40
40 -
 41
41 -
 42
42 -
 43
43 -
 44
44 -
 45
45 -
 46
46 -
 47
47 -
 48
48 -
 49
49 -
 50
50 -
 51
51 -
 52
52 -
 53
53 -
 54
54 -
55
-
56
-
57
-
58
-
59
-
60
-
61
-
62
-
63
-
64
-
65
-
66
-
67
-
68
-
69
-
70
-
71
-
72
-
73
-
74
-
75
-
76
-
77
-
78
-
79
-
80
-
81
-
82
-
83
-
84
-
85
-
86
-
87
-
88
-
89
-
90
-
91
-
92
-
93
-
94
-
95
-
96
-
97
-
98
-
99
-
100
-
101
-
102
-
103
-
104
-
105
-
106
-
107
-
108
-
109
-
110
-
111
-
112
-
113
 |
 |

40
O
PERATING
S
TATISTICS
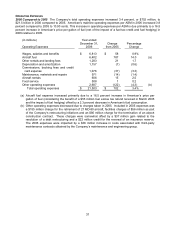
The following table provides statistical information for American and Regional Affiliates for the years ended
December 31, 2006, 2005 and 2004.
Year Ended December 31,
2006 2005 2004
American Airlines, Inc. Mainline Jet Operations
Revenue passenger miles (millions) 139,454 138,374 130,164
Available seat miles (millions) 174,021 176,112 174,015
Cargo ton miles (millions) 2,224 2,209 2,203
Passenger load factor 80.1% 78.6% 74.8%
Passenger revenue yield per passenger mile (cents) 12.81 12.01 11.54
Passenger revenue per available seat mile (cents) 10.26 9.43 8.63
Cargo revenue yield per ton mile (cents) 37.18 35.49 33.51
Operating expenses per available seat mile, excluding
Regional Affiliates (cents) (*)
10.90
10.50
9.73
Fuel consumption (gallons, in millions) 2,881 2,948
3,014
Fuel price per gallon (cents) 200.8 172.3
121.2
Operating aircraft at year-end 697 699 727
Regional Affiliates
Revenue passenger miles (millions) 9,972 8,946 7,283
Available seat miles (millions) 13,554 12,714 10,835
Passenger load factor 73.6% 70.4% 67.2%
(*) Excludes $2.7 billion, $2.5 billion and $2.1 billion of expense incurred related to Regional Affiliates in 2006, 2005
and 2004, respectively.
Outlook
The Company currently expects first quarter mainline unit costs to decrease 1.3 percent compared to the first
quarter of 2006. Full year 2007 mainline unit costs are expected to increase 1.4 percent compared to 2006.
These costs are based on fuel prices resulting from the December forward curve which generated a consolidated
fuel price of $1.83 in the first quarter and $2.12 for all of 2007. Capacity for American’s mainline jet operations is
expected to be approximately flat in the first quarter of 2007 versus first quarter 2006. American’s mainline
capacity for the full year 2007 is expected to decrease approximately one percent from 2006 with more than a
one percent reduction in domestic capacity and less than a one percent decrease in international capacity.